In 11 US states, the average solar payback period stretches beyond 14 years — nearly twice the national median of 7.5 years — and in some cases approaches the useful life of the panels themselves. That’s not a reason to never go solar, but it is a reason to run the numbers carefully before signing anything. Solar is a financial product as much as it is an energy product, and the returns are highly location-dependent. Understanding where solar ROI is weakest can save you from a 25-year commitment that never quite pays off.
The core variables that determine whether solar makes financial sense are electricity rates, peak sun hours, net metering policy, state incentives, and installed system costs. When several of those variables land on the wrong side of the ledger simultaneously — low utility rates, mediocre sun, and weak buyback policies — the math simply stops working in the homeowner’s favour. No amount of enthusiasm for clean energy changes that arithmetic.
This article walks through the states where those variables consistently work against solar investors, explains why, and helps you figure out whether your specific situation is an exception to the general rule.
Why Some States Produce Terrible Solar Returns
The most common misconception about solar economics is that sunlight is the primary driver of payback period. It matters, but it isn’t the deciding variable. Louisiana receives more annual sun hours than Massachusetts, yet Louisiana homeowners face payback periods averaging 14–16 years while Massachusetts homeowners typically break even in 6–7 years. The reason is almost entirely electricity prices.
According to the EIA, Louisiana’s average residential electricity rate sits around 9–10 cents per kilowatt-hour — among the cheapest in the country. Massachusetts pays closer to 25–28 cents. Every kilowatt-hour of solar electricity you generate is worth what you would otherwise pay your utility for it. When that rate is low, your solar savings are low, and the payback timeline stretches accordingly.
Net metering policy is the second major factor. Some states have moved to “net billing” schemes that credit solar exports at the wholesale rate rather than the retail rate — sometimes paying as little as 3–4 cents per kWh for excess power fed back to the grid, versus the 10–25 cents you’d pay to buy that same power back later. This dramatically reduces the value of a solar system that produces more than you consume in daylight hours.
State incentive structures round out the picture. The federal 30% Investment Tax Credit (ITC) is available everywhere in the country through 2032, but state-level rebates, sales tax exemptions, and property tax exemptions vary enormously. States that offer nothing beyond the federal baseline — or that have complicated, slow rebate programs — push effective system costs higher than in states with stronger supplemental incentives.
When you’re evaluating your own situation, using a solar ROI calculator that accounts for your specific utility rate, local sun hours, and net metering terms will give you a far more accurate picture than any state-level average.
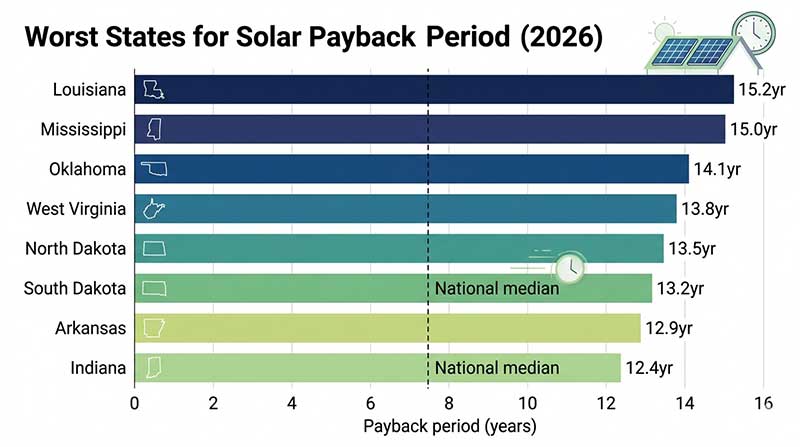
The States With the Worst Solar Payback Periods
Several states consistently appear at the bottom of solar ROI rankings. Here is what the data shows and why.
Louisiana averages 14–16 year payback periods. Cheap natural gas keeps electricity rates around 9 cents/kWh, NREL data shows the state averages around 4.9–5.2 peak sun hours per day (reasonable but not outstanding), and state incentive programs have been minimal compared to neighbouring states. The combination produces ROI numbers that are genuinely difficult to justify for most homeowners. For more on this topic, see our guide to Best States for Solar ROI in 2026. For state-by-state figures, our guide to Solar Panel Payback Period by State shows where solar pays off fastest.
North Dakota and South Dakota face a double penalty: some of the coldest winters in the continental US reduce annual energy production, electricity rates hover around 10–11 cents/kWh, and both states offer limited state-level incentives. Average payback periods run 13–15 years.
West Virginia sits at 11–12 cents/kWh for electricity and has historically had weak net metering policies that have been revised multiple times — creating uncertainty that pushes financing costs up. Payback periods average 13–15 years and solar adoption rates remain among the lowest in the country at under 0.3% of households.
Mississippi mirrors Louisiana’s economics: cheap electricity (around 10 cents/kWh), no state income tax credit for solar, and net metering rules that have faced repeated utility-backed rollback attempts. Average payback runs 14–16 years.
Oklahoma deserves special mention. Despite receiving excellent sunshine — roughly 5.5–6 peak sun hours per day in the western half of the state — electricity rates around 9–10 cents/kWh combined with limited net metering protections produce payback periods of 13–16 years. Oklahoma is the clearest example of the “sunshine doesn’t automatically mean good solar ROI” principle, and a useful reminder that sun hours alone never tell the full financial story.
Low Electricity Rates: The Biggest Enemy of Solar Investment
The electricity rate problem is the one factor homeowners most often underweight when evaluating solar quotes. A 6kW system that produces 8,000 kWh per year saves you $800 at 10 cents/kWh. The same system saves $2,000 at 25 cents/kWh. The physical panels are identical; the financial outcome differs by $1,200 annually, or roughly $25,000–$30,000 over the life of the system.
States with cheap electricity are predominantly those served by utilities with large coal or natural gas generation fleets, strong hydroelectric resources, or regulated monopoly structures that have historically kept rates suppressed. Arkansas, for example, sits at around 9–10 cents/kWh partly because its utility mix still leans heavily on fossil fuel generation — which creates a paradox where the cleanest energy choice is also the least financially compelling one.
The IRA (Inflation Reduction Act) 30% federal tax credit meaningfully improves the economics everywhere, but it cannot fully compensate for a 9-cent electricity rate versus a 25-cent rate. If you’re in a low-rate state, the federal credit cuts your upfront cost by roughly $5,400 on an $18,000 system, reducing your effective spend to about $12,600. At 9 cents/kWh, saving $700–$800 annually on electricity, your payback is still around 15 years. The credit helps but doesn’t transform the investment.
Use the solar payback calculator to input your own electricity rate and see precisely how it shifts the break-even timeline. If your rate is below 12 cents/kWh, prepare for the number to be sobering.
Rate trajectory matters too. Louisiana and Mississippi have seen minimal electricity rate increases over the past decade, according to EIA historical data. If rates stay flat, the solar economics remain weak. If rates rise significantly — which is increasingly possible given grid modernisation costs — the calculus shifts. But betting on utility rate increases is speculation, not a financial plan. Any honest solar financial analysis should model both scenarios and stress-test the investment against flat rates for the full 25-year system life.
Net Metering Rollbacks and Their Real Dollar Impact
Net metering policy changes over the past five years have materially damaged solar ROI in several states. The mechanism matters: under full retail net metering, excess solar power exported to the grid credits your account at the full retail electricity rate. Under net billing or “avoided cost” compensation, you receive only the utility’s avoided generation cost — often 3–5 cents/kWh.
For a homeowner who exports 30% of their system’s production during daytime hours, that difference is substantial. Consider a 7kW system producing 9,500 kWh annually. Under retail net metering at 12 cents/kWh, 2,850 kWh of exports is worth about $342. Under avoided-cost net billing at 4 cents/kWh, those same exports are worth $114 — a $228 annual difference that compounds over 25 years to roughly $5,700 in lost value, not accounting for any rate changes.
Indiana revised its net metering policy in 2022 to phase out retail-rate crediting for new solar customers, moving toward an avoided-cost compensation model. New solar installations in Indiana now face significantly worse economics than systems installed before the policy change. Average payback for new Indiana installations has climbed toward 12–14 years as a result.
Arkansas made similar moves, as did Nevada before partially reversing course after significant industry and consumer pushback. The lesson is that states where utility companies hold significant political influence over energy regulation tend to be higher-risk environments for solar investments, because the net metering rules that validated your original financial case can change after you’ve already committed to a 20-year loan.
Before signing a solar contract in any state, understand not just the current net metering terms but also the regulatory environment. States with independent utility commissions and strong solar-specific legislation offer more policy durability than states where net metering rules are set by utility-influenced commissions with weak consumer representation.
When Solar Still Makes Sense in Low-ROI States
Even in states with weak average solar ROI, individual homeowners can sometimes beat the averages. The key scenarios where solar can still pencil out in low-ROI states involve time-of-use (TOU) rate plans, high-consumption households, and battery storage.
Some utilities in low-rate states offer TOU plans where on-peak electricity costs 18–22 cents/kWh even when the blended average rate is 10 cents. If you can shift your consumption pattern and pair solar with storage, you can arbitrage the rate difference meaningfully. In some cases, the numbers are genuinely attractive even in states that look poor on a simple average-rate basis.
Households consuming 25,000+ kWh annually also change the math significantly. A larger household in Louisiana spending $220–$250 per month on electricity — not unusual for a large home with electric heating or a pool — faces a meaningfully different ROI calculation than a median household spending $110. The payback period for a high-consumption household can come down to 10–12 years even at low rates, which is still long but arguably acceptable for a homeowner planning to stay in place.
Adding battery storage changes the calculus in states where net metering compensation is poor. Rather than exporting cheap power to the grid at 3–5 cents/kWh, you store it and consume it yourself at full retail value. This self-consumption approach can improve effective ROI in net-billing states, though it requires a higher upfront investment — typically adding $10,000–$15,000 to system cost.
Rural homeowners in poor-solar-ROI states who face high delivery charges from their utility may also find the economics better than state averages suggest, since those delivery charges don’t disappear with solar and effectively raise the true cost of grid electricity above the headline rate. If your total electricity bill works out to 14–15 cents per effective kWh once delivery charges are included, the solar case looks considerably stronger than a 10-cent headline rate implies. Run the numbers against your actual bill, not just the published rate, and use the time-of-use savings calculator to model whether a rate-plan switch alongside solar could meaningfully shorten your payback timeline.
Frequently Asked Questions
Which state has the worst solar ROI in the US?
Louisiana and Mississippi consistently rank as the worst states for solar ROI. Both states have residential electricity rates around 9–10 cents per kWh — among the cheapest nationally — which means solar savings accumulate slowly. Combined with limited state incentives, average payback periods run 14–16 years. The federal 30% tax credit applies but cannot fully offset the impact of such low electricity rates on annual savings.
Does sunshine matter more than electricity rates for solar ROI?
Electricity rates typically matter more than sunshine for solar payback period. Oklahoma receives 5.5–6 peak sun hours daily but still faces 13–16 year paybacks because electricity costs only about 9–10 cents/kWh. Massachusetts gets fewer sun hours but achieves 6–7 year paybacks due to rates of 25–28 cents/kWh. Sun hours determine how much energy you produce; electricity rates determine what that energy is worth financially.
What is the average solar payback period in the worst-performing states?
In the 10 states with the weakest solar ROI, average payback periods range from 12 to 16 years, compared to a national median of roughly 7.5 years. States like Louisiana, Mississippi, West Virginia, and North Dakota consistently fall in the 13–16 year range due to low electricity rates, limited state incentives, or unfavourable net metering policies.
Can I improve my solar ROI if I live in a low-return state?
Yes, in some circumstances. Households with high electricity consumption (25,000+ kWh/year), access to time-of-use rate plans with peak pricing of 18–22 cents/kWh, or the ability to add battery storage can significantly improve on state averages. Pairing solar with battery storage lets you self-consume more generation rather than exporting at low net-billing rates of 3–5 cents/kWh.
Do net metering policy changes affect states that already have poor solar ROI?
Yes, and the impact is substantial. States moving from retail-rate net metering to avoided-cost net billing can add 2–4 years to the payback period. Indiana’s 2022 policy change is a clear example — new installations now face 12–14 year paybacks compared to 9–11 years before the change. In states where utility commissions have significant discretion over net metering rules, future policy risk should factor into any long-term solar investment decision.
Data sources: U.S. Energy Information Administration (EIA) Electric Power Monthly, April 2026; National Renewable Energy Laboratory (NREL) PVWatts Calculator and Solar Resource Data; Solar Energy Industries Association (SEIA) Solar Market Insight 2025 Year in Review; IRS Publication 946 and Form 5695 (Residential Clean Energy Credit); Lawrence Berkeley National Laboratory Tracking the Sun 2024.