US residential solar · 2026 data

Sunrun Solar Review 2026: Lease Program Costs and Real User Feedback

SAVE

$0+

Over 25 Years

$16,800 Cost after ITC
9.3 yrs Payback
8.0 kW Typical system

Most homeowners need:

  • 20–24 panels typical
  • 8.0 kW average system
  • $16,800 after tax credits
  • 9.3 year payback
✓ Updated monthly ✓ NREL data ✓ Reviewed by solar experts ✓ IRS tax credit included
· 8 min read ·By ·Reviewed by Green Energy Calculators Editorial Team

Without solar vs with solar

25-year cost comparison for a $300/month US electric bill.

Without solar

25-year utility cost

$75,000

Rates rise ~3% per year (EIA avg.)

With solar

Net system cost

$16,800

After 30% federal ITC

Your savings

Difference

+$58,200

Estimated lifetime advantage

500,000+
calculations completed
25,000+
users monthly

Trusted by US homeowners · Data sourced from

NREL EIA Energy.gov DSIRE IRS / SEIA
Author Mark Sullivan
Reviewed by Green Energy Calculators Editorial Team
Last updated
Sizing formula kW = Annual kWh ÷ (Peak Sun Hours × 365 × 0.82)

Sunrun is the largest residential solar company in the United States, with more than 1 million customers across 24 states as of 2026. That scale means plenty of real-world data — and plenty of opinions, both glowing and critical. If you’re weighing a Sunrun solar lease against buying a system outright, the decision almost always comes down to three things: your monthly bill today, what you’ll owe Sunrun over 25 years, and what happens to your home’s value when it’s time to sell.

The company’s lease product is called BrightSave Monthly. Under this arrangement, Sunrun owns the panels on your roof, handles all maintenance, and charges you a fixed monthly rate for the electricity those panels produce. There’s no large upfront cost, which is the core appeal. The trade-off is that you won’t qualify for the federal solar Investment Tax Credit — worth 30% of system cost under current IRS rules — and your long-term savings are smaller than they would be if you owned the equipment outright.

This review pulls together 2025–2026 installer pricing data, feedback from verified review platforms, and publicly available contract terms to give you a complete picture before you sign anything.
What Sunrun Leases Actually Cost in 2026

Sunrun does not publish standard pricing online, and every quote is customized to your roof, location, and utility. That said, installers and solar marketplaces have collected enough quotes to establish clear patterns. For a typical 8 kW residential system, Sunrun’s BrightSave Monthly lease runs between $90 and $160 per month, depending heavily on your state and local electricity rate. Homeowners in California routinely see quotes at the higher end of that range, while customers in lower-rate markets such as Georgia or Tennessee tend to land closer to $95–$110 per month.

The lease term is 25 years. Sunrun builds in an annual escalator — typically 0% to 2.9% per year — which means your $110 monthly payment in year one could be $183 or more by year 25 at a 2.9% escalator. Before signing, run the numbers yourself: our solar lease vs. buy calculator lets you compare total lease payments against the projected cost of ownership side by side.

Buyout options exist at years 5, 10, 15, and 20. Sunrun calculates the buyout price based on the remaining lease value discounted at a set rate. Most customers who crunch the numbers find that buying out the lease at year 5 or 10 is rarely cheaper than having bought the system at installation. The company also offers a prepaid lease variant (BrightSave Prepaid), where you pay the full estimated lease value upfront — often $10,000–$18,000 for an average system — in exchange for no monthly payments. Prepaid customers still don’t own the system or qualify for the ITC, but they eliminate the escalator risk entirely. Both variants require Sunrun’s approval of your roof condition, a credit score of 650 or above, and verified annual consumption before a contract is offered.

Find your exact solar savings

Enter your ZIP code for a personalized estimate using your state's electricity rate and sun hours.

Free · No signup · Uses EIA & NREL data

How Sunrun Compares to Buying Solar Outright

The financial gap between leasing and owning is substantial over 25 years. NREL’s 2025 residential solar cost data puts the median installed cost for an 8 kW system at roughly $24,000 before incentives. After the 30% federal ITC, that net cost drops to approximately $16,800 for a system the homeowner owns outright. Cumulative lease payments over 25 years at even a modest escalator frequently exceed $40,000 — meaning the lease customer pays substantially more than twice the net cost of a purchased system.

That comparison isn’t entirely fair, because the cash buyer has to find $24,000 upfront or take on a loan. A solar loan at 6.99% APR for 15 years on a $16,800 net cost works out to roughly $151 per month — comparable to a Sunrun lease payment but with full ownership at the end. Our solar payback period calculator can show you the break-even point for both scenarios using your actual utility rate and local electricity price.

For homeowners in states with strong net metering policies — Massachusetts, New Jersey, and Arizona all score well on net metering value — owning makes even more financial sense, because you capture the full retail credit for every kilowatt-hour sent back to the grid. Under a Sunrun lease, Sunrun captures any net metering credits above your contracted rate in states where that’s permitted.

According to SEIA’s 2025 annual report, about 34% of new residential solar installations in the US still go in under a third-party ownership model (lease or PPA). That’s down from a peak of around 72% in 2014, reflecting a steady shift toward ownership as loan products have improved. The trend is clear: leasing has declined because informed customers increasingly do the math and find ownership wins on total dollars spent over the life of the system.

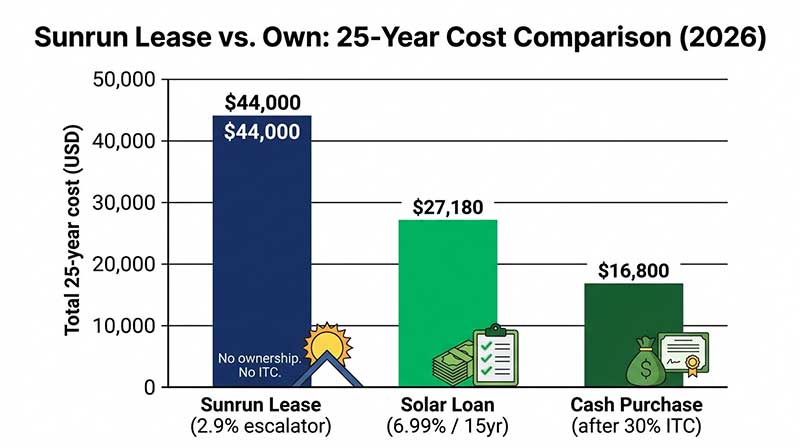
Bar chart comparing total 25-year costs for Sunrun lease, solar loan, and cash purchase
Total 25-year cost: Sunrun lease vs. solar loan vs. cash purchase. A homeowner leasing with a 2.9% annual escalator pays an estimated $44,000 over 25 years — roughly 2.6× the net cost of a cash-purchased system after the 30% ITC. Source: NREL, IRS 2026.

Real Customer Ratings and Common Complaints

Sunrun holds a 3.9 out of 5 rating on Trustpilot based on more than 6,800 reviews as of early 2026, and a 3.6 on the Better Business Bureau platform. Those numbers sit in the middle of the residential solar pack — better than some regional installers, behind a few premium-tier competitors. The pattern across positive reviews is consistent: customers praise the zero-upfront-cost entry point, the 10-year workmanship warranty, and the responsiveness of local installation crews. The pattern across negative reviews is equally consistent: contract complexity, difficulty reaching customer service after installation, and frustration when trying to sell a home with an active lease. For more on this topic, see our guide to Q CELLS Solar Panels Review 2026. For more on this topic, see our guide to Solar Panels in Wisconsin.

The home-sale issue deserves particular attention. When you sell a house with a Sunrun lease, the buyer must either agree to assume the lease or you must pay the remaining buyout price. Some buyers walk away from homes with attached solar leases because they don’t want the 25-year financial obligation. Real estate agents in Florida and Texas — two of Sunrun’s largest markets — report that attached leases occasionally complicate or delay closings. Sunrun states its lease transfer process takes 5–10 business days; a meaningful share of customer reviews dispute that timeline, citing waits of four to six weeks in some cases.

The monitoring app (mySunrun) receives broadly positive marks. Most customers report it accurately reflects daily production, flags outages promptly, and connects reliably to Sunrun’s service portal. Where complaints cluster around the technology side, they typically involve the Brightbox battery add-on integration rather than the monitoring app itself.

One area where Sunrun clearly outperforms many smaller regional competitors is financial stability. The company went public in 2015 and trades on NASDAQ. With over $2.2 billion in revenue in fiscal year 2024, it is unlikely to disappear mid-lease the way some smaller installers have. For a 25-year commitment, counterparty stability genuinely matters — a lease is only as good as the company backing it.

State-by-State Availability and Where the Lease Makes Sense

Sunrun operates in 24 states plus Washington D.C. and Puerto Rico, covering the major solar markets but excluding most of the Southeast and Midwest. The states where it is most competitively priced tend to be those with high electricity rates and strong solar incentives — a combination that narrows the savings gap between leasing and owning and makes the monthly payment easier to justify.

In Hawaii, where residential electricity averages over 39 cents per kWh according to EIA’s 2025 data, even a Sunrun lease with a 2.9% annual escalator can produce meaningful bill savings from day one. The math flips in lower-rate states: in parts of Louisiana, where electricity costs around 11 cents per kWh, the savings from a lease may barely cover the monthly payment in the early years of the contract. Sunrun’s own sales process typically screens out customers where the economics don’t work, but verifying this independently before any sales appointment is worthwhile.

EIA data also shows that electricity prices rose an average of 3.8% annually between 2020 and 2025, which is faster than most Sunrun escalator rates. In markets where utility rates continue to climb quickly, locking in a 2% annual escalator looks attractive compared to uncapped utility rate volatility. That argument is real — it’s one of the company’s core selling points — but it depends on electricity prices continuing to rise faster than the escalator, which is not guaranteed over a full 25-year window.

Sunrun is not available in all 50 states, so homeowners in markets like Montana, the Dakotas, or rural Midwest states may need to look at regional installers or direct-ownership models instead. The IRA’s 30% ITC remains in effect through at least 2032 regardless of which installer you choose, and applies only when you own the system. To model how different electricity rate trajectories affect the lease-versus-own decision in your specific market, our solar savings calculator lets you adjust both the escalator percentage and the projected annual utility rate increase.

Frequently asked questions

Direct answers for US homeowners — sized for a $150/month electric bill.

For homeowners who prefer zero upfront cost or can't qualify for a solar loan, a Sunrun lease provides real bill savings with no installation expense. Over a 25-year term, cumulative lease payments typically exceed $40,000 — far more than the $16,800 net cost of a purchased system after the 30% federal ITC. If you can qualify for financing, ownership almost always wins on total cost.

$150/month electric bill by state

System size and payback vary by electricity rate and sun hours — see your state.

Compare all 50 states for $150/mo →

Popular state solar guides

Electricity rates and incentives vary — see data for your state.

View all 50 states →

Popular utility companies

Solar rules and net metering vary by utility — not just by state.

Methodology & data sources

Calculation method: System size uses NREL PVWatts derate factor (0.82). Costs based on SEIA 2026 installed cost ($2.75–$3.20/W). Payback uses net cost after 30% federal ITC (IRC Section 25D). Savings assume full-retail net metering unless noted.

Official sources: EIA state electricity rates · NREL PVWatts · Energy.gov ITC guide · DSIRE incentives · SEIA market data · IRS Publication 5695.

All figures are estimates for educational purposes — not tax, legal, or investment advice. Consult a licensed installer and CPA for your situation.

Calculate my savings →