US residential solar · 2026 data

Solar Panels in West Virginia: Mon Power and Appalachian Power in a Coal State

SAVE

$0+

Over 25 Years

$16,800 Cost after ITC
21.7 yrs Payback
8.0 kW Typical system

Most homeowners need:

  • 18–22 panels typical
  • 8.0 kW average system
  • $16,800 after tax credits
  • 21.7 year payback
✓ Updated monthly ✓ NREL data ✓ Reviewed by solar experts ✓ IRS tax credit included
· 9 min read ·By ·Reviewed by Green Energy Calculators Editorial Team

Without solar vs with solar

25-year cost comparison for a $300/month US electric bill.

Without solar

25-year utility cost

$32,800

Rates rise ~3% per year (EIA avg.)

With solar

Net system cost

$16,800

After 30% federal ITC

Your savings

Difference

+$16,000

Estimated lifetime advantage

500,000+
calculations completed
25,000+
users monthly

Trusted by US homeowners · Data sourced from

NREL EIA Energy.gov DSIRE IRS / SEIA
Author Mark Sullivan
Reviewed by Green Energy Calculators Editorial Team
Last updated
Sizing formula kW = Annual kWh ÷ (Peak Sun Hours × 365 × 0.82)

West Virginia ranks 48th in the country for solar adoption, yet the average residential electricity bill in the state runs around $126 per month — well above the national median — making the financial case for rooftop solar stronger than most people expect. The state’s coal-heavy identity has long overshadowed its renewable potential, but that is slowly changing as installation costs drop and federal incentives make systems more affordable for ordinary homeowners.

The two dominant utilities — Appalachian Power (a subsidiary of American Electric Power) and Mon Power (part of FirstEnergy) — each operate their own net metering programs, and the differences between them matter a lot when you are trying to figure out whether solar pencils out on your roof. West Virginia has no dedicated state solar tax credit, so the 30% federal Investment Tax Credit under the Inflation Reduction Act is essentially the primary incentive available to residents. That makes understanding federal credits, utility interconnection rules, and realistic output estimates more important here than in states like Virginia or Maryland, which stack additional state-level incentives on top.

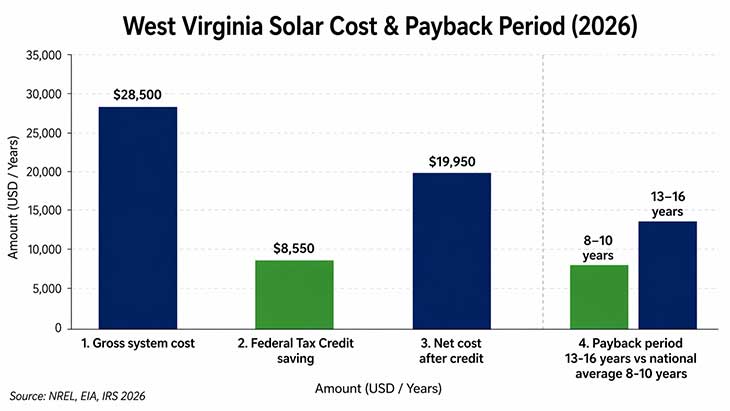
This guide covers what West Virginia homeowners actually need to know: what Mon Power and Appalachian Power will pay you for excess generation, how much a typical system costs after the federal tax credit, and how long you can realistically expect to wait before your panels pay for themselves.

How Net Metering Works Under Mon Power and Appalachian Power

Net metering is the billing mechanism that makes solar economically viable for most homeowners. When your panels produce more electricity than your home is using at that moment, the surplus flows back to the grid and your meter runs backward — or its digital equivalent. At billing time, your export credits offset what you owe for grid electricity you pulled in at night or on cloudy days.

In West Virginia, net metering is governed by the Public Service Commission under state code. Both Mon Power and Appalachian Power are required to offer net metering to residential customers with systems up to 25 kilowatts. Credits are applied at the full retail electricity rate, which is significant: some states only credit solar exports at the lower wholesale rate, cutting the financial return substantially.

Appalachian Power’s residential rate averaged approximately 12.4 cents per kilowatt-hour as of early 2025, according to EIA data. Mon Power customers in the northern part of the state pay slightly different rates depending on their rate class, but the range sits in a similar band. At 12–13 cents per kWh, West Virginia is not a high-electricity-cost state by national standards — Hawaii customers pay more than three times that — but the rates are meaningful relative to local incomes.

Excess credits that accumulate over a billing period roll forward month to month. At the end of each 12-month cycle, any remaining credit is zeroed out, with utilities compensating the surplus at an avoided-cost rate lower than retail. The practical implication: right-sizing your system so that annual production roughly matches annual consumption produces the best financial outcome. Oversizing to bank large surpluses is generally a poor strategy under West Virginia’s current net metering rules.

One important caveat: both utilities can require system inspections, charge interconnection fees, and impose timelines that stretch installation projects by several weeks. Budget 60–90 days from signed contract to Permission to Operate approval. Homeowners who underestimate this lead time often face delays that push their first bill credit to the following billing cycle.

The Real Cost of Going Solar in West Virginia

A typical West Virginia home uses around 13,000 kWh per year, above the national average of roughly 10,500 kWh — partly due to electric heating in older homes and the region’s climate. To cover that consumption, you generally need a solar system in the 9–11 kW range, depending on roof orientation and shading.

At national average installation costs of approximately $2.85 per watt before incentives — NREL’s 2024 benchmark figure — a 10 kW system runs around $28,500 before any credits. After applying the 30% federal Investment Tax Credit, worth $8,550 in this example, the net cost drops to roughly $19,950. You can run those numbers for your situation using the solar tax credit calculator to see exactly what your credit would be based on your system size and tax liability. To apply this credit correctly, start with a firm figure from our guide to How Much Do Solar Panels Cost in 2026? Complete US.

West Virginia has no state income tax credit for solar and no sales tax exemption for solar equipment as of 2025, unlike neighboring Pennsylvania, which exempts solar installations from its 6% sales tax. The Mountain State also lacks a property tax exemption for the added home value solar creates — an omission that modestly increases the effective cost of ownership compared to states with that benefit.

Financing options matter more here than in wealthier markets. Solar loans from credit unions and regional lenders are common, and USDA rural energy programs can apply to homes outside incorporated areas, potentially covering a portion of system costs through grants or loan guarantees. If you are weighing whether to buy outright, finance, or consider a lease or power purchase agreement, the solar lease vs. buy calculator can model how each structure affects your 20-year financial outcome.

Bar chart comparing solar system gross cost, federal tax credit, net cost, and payback period for West Virginia homeowners in 2026
West Virginia solar economics at a glance. A 10 kW system costs around $28,500 before incentives; the 30% federal tax credit reduces net cost to approximately $19,950, with an estimated payback period of 13–16 years against a national average of 8–10 years. Source: NREL, EIA, IRS 2026.

Find your exact solar savings

Enter your ZIP code for a personalized estimate using your state's electricity rate and sun hours.

Free · No signup · Uses EIA & NREL data

Solar Output and Realistic Payback Period for WV Homeowners

West Virginia is not a sun-drenched state. The southern counties around Beckley and Bluefield receive more peak sun hours than the northern panhandle near Wheeling, but neither region approaches the output levels seen in Arizona or Texas. NREL’s PVWatts data puts most of the state in the 4.0–4.5 peak sun hours per day range, with some mountain-shaded valleys coming in below 4.0.

What that means practically: a 10 kW system with a south-facing roof and no significant shading will produce approximately 11,500–13,500 kWh annually in most of West Virginia. That output is enough to substantially offset or fully cover the average household’s consumption, but production varies noticeably by county and microclimate.

The payback period — the number of years until cumulative savings equal your net system cost — sits in the 13–16 year range for most West Virginia installations under current rate structures. That is longer than the national average of 8–10 years, driven by two factors: relatively low electricity rates compared to coastal states, and the absence of state incentives that shorten payback elsewhere. The solar payback calculator can model your specific address, system size, and utility rate to give you a personalized projection rather than a statewide average.

Comparing neighbors is instructive. Kentucky homeowners face similar economics — moderate rates, no state credit — and see comparable payback windows in the 12–15 year range. Ohio offers a slightly better picture thanks to a property tax exemption and higher average electricity rates in some utility territories.

Modern solar panels carry 25-year performance warranties, and quality tier-1 panels typically produce at 85–90% of rated output after 25 years. Even with a 14-year payback in West Virginia, homeowners should expect 10–11 years of essentially free electricity before considering panel replacement. Over a 25-year horizon, a properly sized system could realistically deliver $15,000–$22,000 in net savings after accounting for all upfront expenses and financing costs.

Solar vs utility company · 25-year comparison

Total cost of staying on the grid vs owning solar for a $300/month bill (national average assumptions).

Total utility payments

$32,800

Total solar cost (after ITC)

$16,800

Net savings

+$16,000

Avg. monthly difference

+$63/mo

See my savings →

Choosing an Installer in West Virginia’s Thin Solar Market

West Virginia’s solar market is noticeably thinner than in neighboring states. Fewer installers operate here, which can mean longer lead times, less competitive pricing, and fewer financing options than you would encounter in, say, North Carolina or Georgia. The state does not license solar contractors separately from general electricians, so vetting installer credentials requires more effort from the homeowner.

The most important checks: verify the installer is licensed as an electrical contractor in West Virginia, carries at minimum $1 million in general liability insurance, and has employees certified through NABCEP — the North American Board of Certified Energy Practitioners. NABCEP certification is the industry’s professional credential benchmark and a reasonable proxy for installation quality and system longevity.

Get at least three quotes. Because the installer pool is smaller here, prices can vary by 15–25% for identical system specifications — a wider spread than you would see in more competitive markets. Quotes should itemize equipment (panel brand and model, inverter brand, racking system), labor, permitting fees, and utility interconnection costs separately. Bundled all-in quotes make comparison genuinely difficult and can obscure where markup is being applied.

Understand what happens during grid outages. Standard grid-tied solar systems shut down automatically when the grid fails — a safety feature that prevents backfeed from injuring utility workers. If backup power during outages matters to you (and for many rural West Virginia homeowners it does, given the state’s outage history), you will need battery storage paired with the solar system. A single battery unit adds approximately $10,000–$15,000 to system cost but provides meaningful resilience. SEIA data shows battery attachment rates rising nationally as homeowners in outage-prone regions prioritize resilience over pure financial payback.

Be skeptical of any installer promising payback periods under 8 years without a very specific explanation tied to your actual utility rate, system size, and verified roof conditions. Given West Virginia’s rate environment, those figures require assumptions that rarely hold in practice.

Federal Incentives and Financing Options Available to WV Solar Buyers

Because West Virginia offers no state-level solar incentives, the federal stack carries the full weight of making rooftop solar financially accessible. The 30% Residential Clean Energy Credit under the IRS rules for the Inflation Reduction Act applies to the full installed cost of the system — including panels, inverter, racking, wiring, and battery storage if added at the same time. There is no dollar cap on the residential credit, which means larger systems generate proportionally larger credits.

One nuance that catches many homeowners off guard: the tax credit reduces your federal income tax liability dollar for dollar, but it is not refundable. If your credit exceeds your tax bill in year one, you can carry the remaining balance forward to subsequent tax years. For retired homeowners with lower taxable income, this means the full benefit may take two or three years to materialize. Consulting a tax professional before signing a contract is worthwhile if your annual federal tax liability is under $8,000.

For lower-income households, the Inflation Reduction Act also introduced the Energy Efficient Home Improvement Credit (25C) covering up to $1,200 per year for qualifying upgrades like insulation and efficient windows — separate from the solar credit. While not a solar incentive directly, stacking these credits in the same tax year can meaningfully reduce a household’s overall energy costs.

USDA’s Rural Energy for America Program (REAP) offers grants covering up to 25% of project costs for agricultural producers and rural small businesses, and some West Virginia homeowners in rural counties may qualify if they run a home-based business. REAP grants are competitive and require an application, but the 2024 round funded projects across Appalachian states at meaningful dollar amounts.

For homeowners who want to model total 20-year return including financing costs and rate escalation assumptions, the solar ROI calculator provides a comprehensive framework that accounts for loan interest, utility rate inflation, and panel degradation over time.

Frequently asked questions

Direct answers for US homeowners in West Virginia.

No. West Virginia offers no state income tax credit for solar installations as of 2025. The primary incentive available to Mountain State homeowners is the federal 30% Investment Tax Credit under the Inflation Reduction Act, worth $8,550 on a typical $28,500 system. There is no state sales tax exemption or property tax exemption for solar in West Virginia, unlike many neighboring states that stack additional incentives on top of the federal credit.

$75/month electric bill by state

System size and payback vary by electricity rate and sun hours — see your state.

Compare all 50 states for $75/mo →

Popular state solar guides

Electricity rates and incentives vary — see data for your state.

View all 50 states →

Popular utility companies

Solar rules and net metering vary by utility — not just by state.

Methodology & data sources

Calculation method: System size uses NREL PVWatts derate factor (0.82). Costs based on SEIA 2026 installed cost ($2.75–$3.20/W). Payback uses net cost after 30% federal ITC (IRC Section 25D). Savings assume full-retail net metering unless noted.

Official sources: EIA state electricity rates · NREL PVWatts · Energy.gov ITC guide · DSIRE incentives · SEIA market data · IRS Publication 5695.

All figures are estimates for educational purposes — not tax, legal, or investment advice. Consult a licensed installer and CPA for your situation.

Calculate my savings →