US residential solar · 2026 data

Solar Panels in Utah

SAVE

$0+

Over 25 Years

$18,900 Cost after ITC
17.4 yrs Payback
9.0 kW Typical system

Most homeowners need:

  • 21–25 panels typical
  • 9.0 kW average system
  • $18,900 after tax credits
  • 17.4 year payback
✓ Updated monthly ✓ NREL data ✓ Reviewed by solar experts ✓ IRS tax credit included
· 10 min read ·By ·Reviewed by Green Energy Calculators Editorial Team

Without solar vs with solar

25-year cost comparison for a $300/month US electric bill.

Without solar

25-year utility cost

$45,500

Rates rise ~3% per year (EIA avg.)

With solar

Net system cost

$18,900

After 30% federal ITC

Your savings

Difference

+$26,600

Estimated lifetime advantage

500,000+
calculations completed
25,000+
users monthly

Trusted by US homeowners · Data sourced from

NREL EIA Energy.gov DSIRE IRS / SEIA
Author Mark Sullivan
Reviewed by Green Energy Calculators Editorial Team
Last updated
Sizing formula kW = Annual kWh ÷ (Peak Sun Hours × 365 × 0.82)

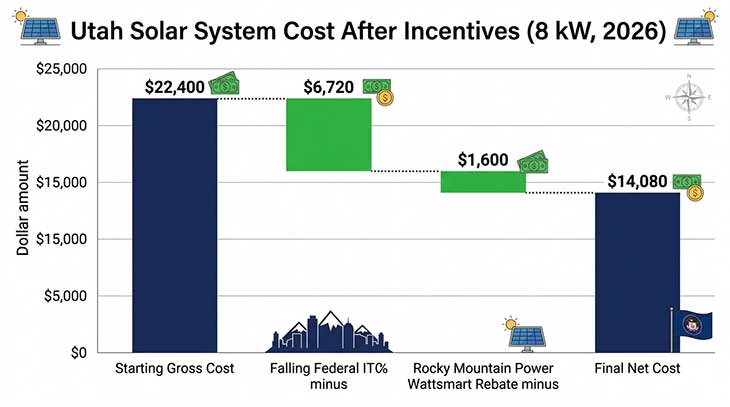
Utah homeowners installing solar in 2026 can stack three separate incentives — a $1,600 utility rebate, a 30% federal tax credit, and net metering credits — that together cut the effective cost of a typical 8 kW system from roughly $22,400 down to around $14,080. That combination puts the state in a stronger position than many neighbours, even though Utah’s retail electricity rate of about 10.7 cents per kWh (EIA, 2025 average) is lower than the national average of 16.4 cents. The lower rate lengthens payback somewhat, but the incentive stack compensates more than most homeowners expect.

Rocky Mountain Power serves approximately 1.1 million customers across Utah, Wyoming, and Idaho, and it remains the dominant utility for Wasatch Front residents from Ogden south through Provo. Its net metering tariff — Schedule 135 — is the financial engine behind most rooftop solar economics in the state. Understanding exactly how that tariff works, what the $1,600 rebate covers, and how the federal Inflation Reduction Act credit layers on top is the starting point for any honest payback calculation.

This guide covers the mechanics of each incentive, realistic production numbers for Utah’s geography, and what to watch for as Rocky Mountain Power transitions toward a new rate structure by 2027. Numbers are drawn from EIA, NREL, and Rocky Mountain Power’s published tariff filings.

How Rocky Mountain Power’s Schedule 135 Net Metering Works

Rocky Mountain Power’s Schedule 135 credits excess solar generation at the full retail rate — currently 10.7 cents per kWh — for residential customers who installed systems before the programme’s transition deadline. That retail-rate credit is the most generous arrangement available in Utah, and it explains why acting sooner rather than later matters: the utility has signalled it will shift new applicants to a lower “avoided cost” export rate, estimated at 4–5 cents per kWh, once the transition is finalised.

Under the current structure, credits accumulate monthly and roll forward. Any surplus remaining at the end of a 12-month true-up period is paid out at the lower avoided-cost rate rather than retail. The gap between the mid-year rate you receive and the true-up payout means you want to size your system so annual production closely matches annual consumption, rather than overshooting and leaving large credits on the table. A system sized for 100–105% of your annual usage is the standard target for Utah installations.

Utah’s average residential customer consumes about 762 kWh per month, or roughly 9,150 kWh per year — well below the national average of 10,500 kWh. That lower baseline means a smaller, less expensive system often covers the full load. NREL’s PVWatts data shows Salt Lake City averaging 5.26 peak sun hours per day, competitive with Arizona at 5.7 hours and well ahead of Oregon at 4.1 hours. That sun resource means an 8 kW system in Salt Lake City produces approximately 12,000–12,500 kWh per year under typical conditions, comfortably covering a standard Utah home’s annual electricity use.

Rocky Mountain Power also offers time-of-use (TOU) rate options for solar customers. With battery storage, TOU rates can increase savings by allowing you to discharge stored power during on-peak price windows — typically 3–8 p.m. on weekdays — when the grid pays most. Without storage, TOU requires careful consideration: panels produce most during midday hours when TOU rates often sit in the off-peak window. Homeowners on the standard Schedule 1 rate avoid this mismatch and benefit straightforwardly from retail-rate net metering credits while the grandfathered terms remain in force.

The $1,600 Rocky Mountain Power Wattsmart Solar Rebate

Rocky Mountain Power’s Wattsmart solar rebate pays $0.20 per watt of installed capacity, up to a maximum of $1,600 for systems of 8 kW or larger. For a typical Utah home installing an 8 kW system, the full $1,600 is available — the programme caps out exactly at the size most homeowners need. Smaller systems earn proportionally: a 5 kW installation receives $1,000, and a 6 kW system earns $1,200.

The rebate arrives as a bill credit within approximately 60–90 days of system energisation and passing Rocky Mountain Power’s interconnection inspection. Crucially, the rebate is not deducted from your system cost before calculating the federal Investment Tax Credit (ITC). That sequencing matters for tax planning: an installer quote of $22,400 generates a $6,720 federal credit (30% ITC), and then the $1,600 rebate reduces your net out-of-pocket to approximately $14,080 — not $13,700 as many online estimates suggest when they apply the rebate before calculating the ITC.

The Wattsmart programme operates on an annual budget, and Rocky Mountain Power has historically exhausted funds before year-end in recent years. Submitting your application promptly after installation and inspection is therefore essential. Contractors familiar with the utility’s online interconnection portal can usually complete this step within one to two weeks of commissioning. Homeowners who miss the annual funding window must wait until the following calendar year for the rebate, which can delay the financial case for going solar.

The solar tax credit calculator lets you model exactly how the 30% ITC and the $1,600 rebate interact with your specific system cost and tax liability, including scenarios where you carry unused credit forward across multiple tax years under IRS rules.

Waterfall chart showing Utah 8 kW solar system cost after federal tax credit and Rocky Mountain Power rebate
Utah solar costs after incentives stack (8 kW system, 2026). A $22,400 gross system cost falls to $14,080 after the 30% federal ITC ($6,720) and the $1,600 Rocky Mountain Power Wattsmart rebate — a combined reduction of 37%. Source: IRS, Rocky Mountain Power, NREL 2026.

Utah Solar Payback Period: What to Expect in 2026

The payback period for solar in Utah lands between 9 and 12 years for most Wasatch Front homeowners, with the range driven by roof orientation, shading, financing method, and how quickly Rocky Mountain Power’s rates rise over time. NREL’s 2024 solar cost benchmarks put the installed cost of a residential system at $2.80–$3.10 per watt before incentives, so an 8 kW system falls in the $22,400–$24,800 range depending on panel brand, roof complexity, and local labour. For state-level payback data with the ITC applied, see our guide to Solar Panel Payback Period by State. For more on this topic, see our guide to Solar Panels in Virginia.

After the 30% ITC and the $1,600 rebate, the net cost of roughly $14,000–$15,700 is recovered through annual bill savings. At 10.7 cents per kWh and 12,200 kWh of annual production offset against a home using 9,150 kWh, savings come from two sources: the value of power you consume directly (self-consumption) and the retail-rate credits for excess export. Homes occupied during the day — remote workers, retirees — typically self-consume 60–70% of production and earn retail credits on the rest, pushing effective annual savings toward $1,300–$1,450. That puts payback at roughly 10–11 years on a cash purchase.

Finance charges alter the picture. A solar loan at 7.5% APR over 20 years on a $14,000 balance adds interest that extends effective payback, though monthly loan payments often come in below the electricity bill being replaced. Utah’s electricity rates have risen at an average annual rate of about 3.2% over the past decade (EIA historical data), which meaningfully improves long-term solar returns: a system saving $1,350 in year one saves roughly $1,900 in year 15 if that trend holds, shrinking effective payback by one to two years compared with a flat-rate assumption.

Comparing Utah with neighbouring Colorado is instructive: Colorado’s higher retail rate of around 13.5 cents per kWh gives Denver-area homeowners a shorter payback of roughly 8–9 years even with similar sun resources. Utah’s lower electricity rate is the primary driver of its slightly longer timeline, but the stronger incentive stack narrows the gap.

Homeowners weighing cash versus financing can model total 25-year returns under different loan terms and rate-escalation scenarios with the solar savings calculator.

Solar vs utility company · 25-year comparison

Total cost of staying on the grid vs owning solar for a $300/month bill (national average assumptions).

Total utility payments

$45,500

Total solar cost (after ITC)

$18,900

Net savings

+$26,600

Avg. monthly difference

+$90/mo

See my savings →

Battery Storage and Time-of-Use Savings in Utah

Battery storage is not yet financially essential for most Utah solar owners, but Rocky Mountain Power’s evolving rate structure is starting to make the economics work for more households. The utility’s E-36 time-of-use rate tier charges 15–17 cents per kWh during on-peak hours (3–8 p.m. weekdays, May through September) and as low as 7 cents per kWh during off-peak periods. A battery charged from solar midday and discharged during on-peak hours captures that price spread — roughly 8–10 cents per kWh — on every cycle throughout the summer months.

A 13.5 kWh battery (one Tesla Powerwall 3 equivalent) installed alongside a solar system costs approximately $10,000–$13,000 before applying the 30% ITC to the combined solar-plus-storage system. Standalone storage without solar does not qualify for the ITC in 2026 unless the battery is charged at least 70% from solar — a requirement embedded in IRS guidance on the Inflation Reduction Act. That rule means most Utah homeowners pair storage with solar from the outset rather than adding batteries separately later.

The financial return on a battery in Utah is modest in isolation — expect $300–$500 per year in time-of-use arbitrage savings at current rates — but backup power value during outages has become a significant driver regardless of pure economics. Utah averages 1.1 hours of outage time per customer per year (EIA 2023 SAIDI data), relatively low nationally, but wildfire-related grid disruptions are increasing across the Mountain West.

Nevada offers a useful contrast: NV Energy’s higher electricity costs make battery storage financially compelling, with paybacks under seven years on some installations. Utah is not there yet, but Rocky Mountain Power’s rate trajectory points in that direction over the next five years. For rural properties in Utah’s Uinta Basin or Kane County, diesel generator replacement costs and avoided grid-extension fees can make larger battery banks viable even without peak-rate arbitrage.

Use the solar payback calculator to model combined solar-plus-storage systems with your actual TOU rate schedule and estimate how long the full investment takes to recover.

Choosing a Utah Solar Installer and Avoiding Common Pitfalls

Most Utah homeowners receive quotes from three to five solar contractors, and the spread between the lowest and highest bids for an identical 8 kW system commonly reaches $4,000–$6,000. That variation reflects differences in panel quality, inverter brand, and warranty terms — not simply profit margin. A quote of $2.60 per watt may use Tier 2 panels with 10-year product warranties, while a $3.10 per watt quote from an established installer includes 25-year performance warranties backed by a manufacturer with a proven support history.

Verify that any installer holds certification from the North American Board of Certified Energy Practitioners (NABCEP). Rocky Mountain Power’s interconnection requirements mandate that all equipment meets UL listing standards and that the installation complies with the 2023 National Electrical Code — reputable installers handle both automatically, but confirming before signing protects you from post-installation delays.

SEIA’s 2025 Utah market data shows the state added 312 MW of residential solar capacity in 2024. That growth means installer backlogs extend 8–12 weeks during peak spring and autumn seasons, so homeowners wanting to energise before Rocky Mountain Power’s net metering transition closes the retail-rate window should start the process early in the year.

For Idaho residents served by Rocky Mountain Power across the state border, the Wattsmart rebate differs — Idaho’s rate is $0.15 per watt rather than $0.20, with a lower programme cap. Washington state homeowners face a different incentive landscape entirely, with stronger community solar options but no equivalent utility rebate. Always compare your state’s full incentive picture before committing.

Salt Lake County requires a separate electrical permit in addition to a building permit for rooftop solar. Skipping it delays the Rocky Mountain Power interconnection inspection by four to six weeks. A correctly filed installation averages 45–60 days from permit submission to permission to operate in 2026, making early paperwork the most reliable way to stay ahead of the Wattsmart budget deadline.

Frequently asked questions

Direct answers for US homeowners in Utah.

Rocky Mountain Power's Schedule 135 net metering covers most of Utah, but some municipalities — including much of St. George — fall under Dixie Power or Washington City Power. Check your utility bill or call Rocky Mountain Power at 1-888-221-7070 to confirm your service area. Customers outside Rocky Mountain Power's territory need to review their specific utility's net metering tariff, which varies considerably and may offer different export rates and credit structures.

Popular utility companies

Solar rules and net metering vary by utility — not just by state.

Methodology & data sources

Calculation method: System size uses NREL PVWatts derate factor (0.82). Costs based on SEIA 2026 installed cost ($2.75–$3.20/W). Payback uses net cost after 30% federal ITC (IRC Section 25D). Savings assume full-retail net metering unless noted.

Official sources: EIA state electricity rates · NREL PVWatts · Energy.gov ITC guide · DSIRE incentives · SEIA market data · IRS Publication 5695.

All figures are estimates for educational purposes — not tax, legal, or investment advice. Consult a licensed installer and CPA for your situation.

Calculate my savings →