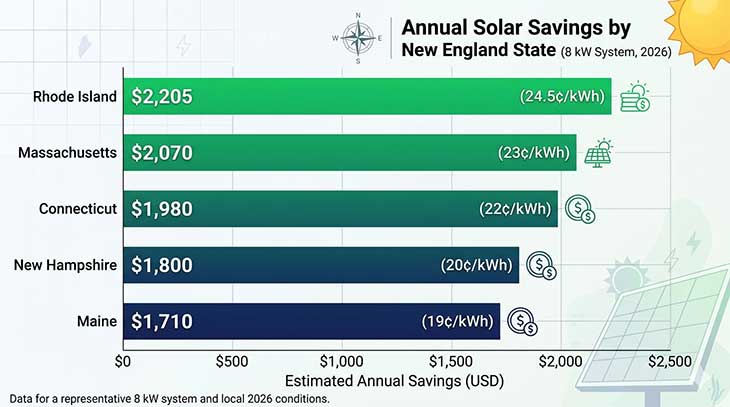
Rhode Island homeowners paid an average of 24.5 cents per kilowatt-hour for electricity in 2025, according to the U.S. Energy Information Administration — the highest residential rate in all of New England and nearly double the national average of 13.2¢/kWh. That single number reshapes the entire solar math for Ocean State homeowners. When electricity costs that much, every kilowatt-hour your panels produce is worth twice what it would be worth in Louisiana or Indiana.
The state is small — roughly 1,212 square miles — but its solar ambitions are not. Rhode Island has set a Renewable Energy Standard requiring 100% renewable electricity by 2033, and state incentives are stacked in ways that make the economics hard to ignore. Between net metering at full retail rate, a state-level property tax exemption on solar equipment, and the federal 30% Investment Tax Credit, a typical 8-kilowatt system can pencil out with a payback period of under seven years for many households.
This guide walks through exactly what solar panels cost in Rhode Island right now, what you can expect to earn back, which incentives apply to you, and how the numbers compare to neighboring states — so you can decide whether going solar makes sense for your roof, your bill, and your timeline.
What Solar Panels Actually Cost in Rhode Island in 2026
The installed cost of a residential solar system in Rhode Island runs between $2.80 and $3.40 per watt before incentives, based on data compiled by SEIA and local installer quotes. For a typical 8 kW system — enough to cover most 1,500–2,000 sq ft homes with average energy use — that puts the gross price between $22,400 and $27,200.
After applying the federal Investment Tax Credit at 30%, that range drops to $15,680–$19,040. The ITC is a direct reduction in what you owe the IRS, not a deduction from income, so its value is dollar-for-dollar against your federal tax liability. If your system costs $25,000, the credit is $7,500. You need to owe at least that much in federal taxes in the year you install — or carry the remainder forward into subsequent years — to capture the full benefit. Use our solar tax credit calculator to model exactly how much of the ITC you can use based on your income and filing status.
Rhode Island also exempts solar installations from the state’s sales tax (7%) and from property tax assessment increases. The sales tax exemption alone saves roughly $1,540–$1,904 on a typical system. The property tax exemption means your home’s assessed value can rise after installation without triggering a higher tax bill — a meaningful benefit in a state where median home values top $400,000.
Labor costs in Rhode Island run slightly higher than in southern states due to unionization and cost of living, but installation timelines are generally 60–90 days from signed contract to permission-to-operate, which is faster than the national average of around 120 days. Permitting in most Rhode Island municipalities has been streamlined under state-level solar permitting reform passed in 2021, reducing administrative delays that previously added weeks to projects.
Installer competition in the state has grown steadily since 2020. SEIA counted more than 40 active residential solar installers operating in Rhode Island as of 2025, keeping prices competitive and giving homeowners genuine choice when comparing quotes.
Rhode Island Net Metering Policy: Why Full Retail Credit Changes Everything
Net metering is the policy that determines how much your utility pays you for excess solar electricity you export to the grid. Rhode Island’s policy is among the most favorable in the country: National Grid credits solar customers at the full retail electricity rate — currently 24.5¢/kWh — for every kilowatt-hour they send back.
That stands in sharp contrast to states like California, which has moved to a net billing model that compensates exports at a much lower avoided-cost rate, dramatically lengthening payback periods there. Rhode Island has held firm on retail-rate net metering, and the policy currently has no announced sunset date, though the Public Utilities Commission reviews it periodically.
Credits accumulate monthly and roll forward. Any surplus at the end of a 12-month period is paid out at the avoided-cost rate (roughly 7–9¢/kWh), so the goal is to size your system to produce roughly what you consume annually — not more. Our solar net metering calculator helps you model the optimal system size based on your monthly consumption and the local compensation structure.
For a household using 750 kWh per month — close to the Rhode Island residential average — an 8 kW system producing roughly 9,000 kWh per year would offset almost the entire bill while leaving minimal surplus that earns the lower rate. The annual savings at a 24.5¢/kWh rate come to approximately $2,205 per year, before accounting for any fixed monthly charges that remain on the bill regardless of solar production. For a full price breakdown by system size and region, see our guide to How Much Do Solar Panels Cost in 2026? Complete US.
Compare that to a neighbor in Connecticut, where rates average around 22¢/kWh, or Massachusetts, which sits at roughly 23¢/kWh — both high, but Rhode Island’s rate still edges them out. Those extra cents add up to several hundred dollars in additional annual savings over the life of a system.

Solar Payback Period in Rhode Island: How Fast Do Panels Pay Off?
At current costs and rates, the average Rhode Island solar payback period falls between 6.5 and 8 years — solidly in the range that financial planners consider a strong return on a home improvement investment. For context, NREL data places the national average payback period at around 8–9 years; Rhode Island’s high utility rates pull it well below that benchmark.
Here is the simplified math for a typical scenario. Gross system cost: $25,000. Federal ITC at 30%: minus $7,500. Net cost: $17,500. Annual electricity savings: $2,205. Simple payback: 7.9 years. Over a 25-year panel warranty period, that same household accumulates roughly $55,125 in savings at today’s rates — and electricity rates in Rhode Island have risen an average of 3.2% per year over the past decade, so future savings are likely higher in nominal terms.
One factor that meaningfully shortens the payback period is shading. Rhode Island averages around 4.2 peak sun hours per day — lower than Arizona’s 6.5 or Texas’s 5.8, but sufficient to produce strong annual output if panels are unshaded and properly oriented. A south-facing roof at a 30–40 degree pitch is ideal; east or west orientations reduce output by 10–20% but are still financially viable given the high retail credit rate.
Financing also shapes payback. A cash purchase produces the fastest payback and highest lifetime return. A solar loan at 6–8% APR adds interest costs but requires no upfront capital, making solar accessible to households without $15,000–$20,000 in liquid savings. Leases and power purchase agreements eliminate upfront cost entirely but transfer most of the financial upside to the installer — the monthly payment is lower than a utility bill, but the long-term savings are a fraction of what ownership delivers.
For households weighing loan versus cash, the solar savings calculator lets you compare total lifetime return under each financing structure using your actual electricity rate and system cost.
Rhode Island Solar Incentives Beyond the Federal Tax Credit
Beyond the federal ITC and retail-rate net metering, Rhode Island has several targeted programs that can further reduce costs or accelerate payback for qualifying households.
The Rhode Island Renewable Energy Fund, administered by the Rhode Island Office of Energy Resources, has historically offered grants of $500 to $5,000 for residential solar installations depending on system size and applicant category. Funding availability changes annually, and the program has been oversubscribed in recent years, so applying early in the calendar year improves the odds of receiving an award.
The Renewable Energy Growth Program is a tariff-based incentive for systems up to 5 MW. Small residential systems under 25 kW can participate if net metering capacity is temporarily constrained in their utility territory. Under this program, customers receive a fixed per-kWh payment for all electricity produced — not just surplus — which can occasionally outperform standard net metering depending on individual consumption patterns and time of production.
Low-income households may qualify for the LIHEAP Solar Program or utility-administered low-income solar carve-outs, which offer deeper incentives and sometimes community solar subscriptions requiring no rooftop installation. Community solar in Rhode Island lets renters or homeowners with unsuitable roofs subscribe to a share of an offsite array and receive bill credits — typically saving 5–15% on the subscribed portion of electricity use.
The Inflation Reduction Act, active through at least 2032 per IRS guidance, layered additional incentives on top of the standard 30% ITC. Low-to-moderate income households may qualify for an enhanced credit of up to 40% of system cost. Households in designated energy communities — census tracts with a history of fossil fuel employment or coal plant closures — receive an additional 10% adder. Rhode Island has several qualifying energy community tracts, particularly in Providence County, which can push the effective credit to 40% for eligible filers.
How Rhode Island Solar Compares to Other High-Rate States
Rhode Island’s solar proposition becomes clearest when placed alongside other expensive-electricity states. Hawaii leads the nation at roughly 40¢/kWh, making it the extreme case where solar nearly always pays off in under five years. But Hawaii’s geographic isolation and import costs make it an outlier. Rhode Island sits in a more instructive peer group: high-density Northeast states with aging grid infrastructure and limited local generation capacity.
New York averages around 20–22¢/kWh in many utility territories, and New Jersey runs 17–19¢/kWh — both meaningfully lower than Rhode Island. Identical systems installed on identical roofs in identical orientations will pay back faster in Rhode Island than in most neighbors simply because each exported or self-consumed kilowatt-hour is worth more at the meter.
The counterargument often raised about Rhode Island is system output — the state’s modest sun hours mean panels produce less energy per installed kilowatt than in sun-belt states. True, but the math still favors the Ocean State. An 8 kW system in Arizona might produce 13,500 kWh per year at an average retail rate of 14¢/kWh, yielding $1,890 in annual savings. The same 8 kW system in Rhode Island produces roughly 9,000 kWh at 24.5¢/kWh, yielding $2,205 — about 17% more in annual savings despite 33% less sun. High rates beat high sun in this comparison.
For households considering battery storage alongside solar, the economics in Rhode Island are also improving. Time-of-use rates are not yet mandatory for most residential customers, but National Grid has piloted optional TOU programs where peak rates can exceed 35¢/kWh on summer afternoons. A battery that shifts consumption out of peak windows can add $300–$600 per year in savings on top of standard net metering, and NREL projects that TOU adoption in New England will accelerate through 2028 as grid modernization continues.
Before signing a contract with any installer, run your numbers through the solar payback period calculator to confirm whether the system size, financing terms, and quoted price actually deliver the return the salesperson is promising.
Frequently Asked Questions
Is solar worth it in Rhode Island given the lower sun hours? Yes. Rhode Island’s average electricity rate of 24.5¢/kWh more than compensates for the state’s 4.2 peak sun hours per day. An 8 kW system typically saves around $2,205 per year — more than the same system would save in sunnier but cheaper-electricity states like Arizona. The payback period for most systems falls between 6.5 and 8 years, well below the national average of 8–9 years.
What is the average solar payback period in Rhode Island? Most Rhode Island homeowners see a payback period of 6.5 to 8 years after the 30% federal tax credit. On a $25,000 system, the ITC reduces out-of-pocket cost to roughly $17,500. At $2,205 in annual savings, simple payback is under 8 years. Over a 25-year warranty period, total savings can exceed $55,000 at today’s rates, not accounting for future electricity rate increases.
Does Rhode Island have a solar sales tax exemption? Yes. Rhode Island exempts solar energy equipment from the state’s 7% sales tax. On a $25,000 system, that saves approximately $1,750 upfront. The state also provides a property tax exemption, so your assessed home value can rise after installation without triggering higher property taxes — a meaningful benefit where median home values exceed $400,000.
How does net metering work in Rhode Island? National Grid credits rooftop solar customers at the full retail electricity rate — currently 24.5¢/kWh — for every kilowatt-hour exported to the grid. Credits roll forward monthly for 12 months. Any unused surplus at year-end is paid out at the lower avoided-cost rate of roughly 7–9¢/kWh. The retail-rate net metering policy has no announced sunset date as of 2026.
Can renters or homeowners with shaded roofs go solar in Rhode Island? Yes, through community solar. Rhode Island’s program lets customers subscribe to a share of an offsite solar array and receive bill credits without installing anything on their own roof. Savings typically range from 5–15% on the subscribed portion of electricity use. Low-income households may qualify for discounted subscriptions through utility-administered carve-out programs.
Data sources: U.S. Energy Information Administration (EIA) Electric Power Monthly, April 2026; National Renewable Energy Laboratory (NREL) PVWatts Calculator and solar cost benchmarks, 2025–2026; Solar Energy Industries Association (SEIA) Rhode Island Solar Market Insight, Q1 2026; IRS Publication 946 and IRS Form 5695 instructions covering the Investment Tax Credit; Rhode Island Office of Energy Resources, Renewable Energy Fund program documentation, 2026; Rhode Island Public Utilities Commission, Net Metering tariff schedules, 2025.