US residential solar · 2026 data

Solar Panels in Oklahoma

SAVE

$0+

Over 25 Years

$18,900 Cost after ITC
18.6 yrs Payback
9.0 kW Typical system

Most homeowners need:

  • 21–25 panels typical
  • 9.0 kW average system
  • $18,900 after tax credits
  • 18.6 year payback
✓ Updated monthly ✓ NREL data ✓ Reviewed by solar experts ✓ IRS tax credit included
· 10 min read ·By ·Reviewed by Green Energy Calculators Editorial Team

Without solar vs with solar

25-year cost comparison for a $300/month US electric bill.

Without solar

25-year utility cost

$42,900

Rates rise ~3% per year (EIA avg.)

With solar

Net system cost

$18,900

After 30% federal ITC

Your savings

Difference

+$24,000

Estimated lifetime advantage

500,000+
calculations completed
25,000+
users monthly

Trusted by US homeowners · Data sourced from

NREL EIA Energy.gov DSIRE IRS / SEIA
Author Mark Sullivan
Reviewed by Green Energy Calculators Editorial Team
Last updated
Sizing formula kW = Annual kWh ÷ (Peak Sun Hours × 365 × 0.82)

Oklahoma averages just 9.7 cents per kilowatt-hour for residential electricity — roughly 24% below the national average of 12.8 cents, according to the EIA’s most recent state-level data. That single number shapes every solar calculation in the state. It doesn’t make solar a bad investment here, but it does mean you need sharper pencils than homeowners in, say, California or Massachusetts, where rates above 20 cents per kWh make panels pencil out fast. In Oklahoma, the math rewards patience and careful system sizing.

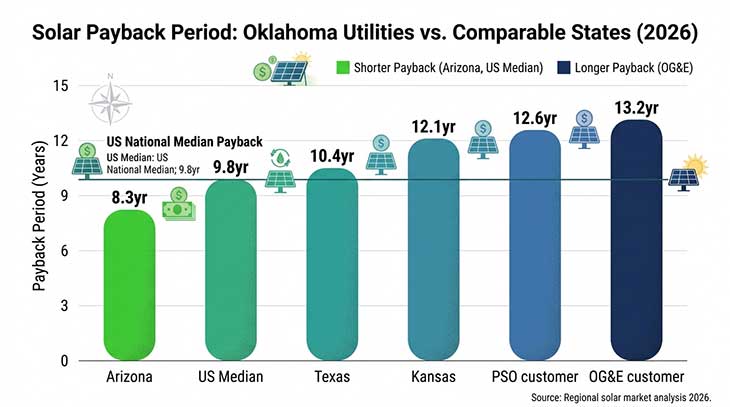
The state’s solar market is dominated by two investor-owned utilities: Oklahoma Gas & Electric (OG&E), which serves the Oklahoma City metro and eastern Oklahoma, and Public Service Company of Oklahoma (PSO), a unit of AEP that covers Tulsa and the southeastern corner of the state. Both offer net metering programs, but the compensation rates, billing mechanics, and interconnection timelines differ in ways that directly affect your return. About 28% of Oklahoma households fall under rural electric cooperatives, which operate under separate — and often less generous — net metering rules set at the co-op level.

Oklahoma also sits in one of the best solar resource zones in the country. The state averages 5.5 to 6.1 peak sun hours per day, comparable to Arizona in its southern counties. That irradiance partly offsets the low electricity rate, producing more kilowatt-hours per installed watt than most Midwest states. A 10 kW system here generates roughly 14,500 kWh per year, versus about 12,800 kWh for the same system in Ohio. More production helps, but it only matters if the utility credits that production at a fair rate.

How OG&E Net Metering Works in 2026

OG&E offers true net energy metering under its tariff schedule NM-1, which applies to residential customers with systems up to 25 kW AC. Under NM-1, excess generation fed to the grid during daylight hours offsets future consumption on a kilowatt-hour-for-kilowatt-hour basis — you get full retail credit, not a wholesale rate. At OG&E’s current residential rate of approximately 9.4 cents per kWh (base rate plus standard riders), that retail credit is the backbone of your solar economics.

The billing cycle matters significantly for how you size an Oklahoma solar system. OG&E uses a monthly netting approach rather than annual true-up, meaning any surplus credits remaining at the end of each billing month are carried forward for up to 12 months. Credits that expire after 12 months are forfeited — not paid out in cash. This strongly favors systems sized to match your monthly consumption rather than systems designed to bank large annual surpluses. Oversizing a system to sell electricity back to OG&E is a poor strategy under the current tariff.

Interconnection under OG&E runs 30–60 days for residential systems using certified equipment, and the utility requires a dedicated production meter alongside your existing consumption meter. The application fee is $100 for systems under 10 kW. OG&E also requires a $2-per-month fixed charge for net metering customers, which adds about $24 per year to your ownership costs — a minor figure, but worth including in any solar payback period calculation.

One important caveat: OG&E has petitioned the Oklahoma Corporation Commission (OCC) in previous rate cases to reduce net metering compensation, arguing that solar customers shift grid costs onto non-solar ratepayers. As of early 2026, the retail-rate credit remains intact, but the OCC has granted utilities in other states the ability to move to avoided-cost compensation. Monitoring OCC dockets is wise for any Oklahoma homeowner considering solar. To model your precise annual savings under OG&E’s current tariff, the solar net metering calculator can run scenarios with different credit rates and monthly consumption profiles.

How PSO Net Metering Works in 2026

PSO operates its net metering program under Oklahoma Corporation Commission rules with a similar structure to OG&E but with meaningful differences. PSO’s base residential rate sits at approximately 10.1 cents per kWh as of 2026 — slightly higher than OG&E’s — which improves the financial case for solar customers in Tulsa and surrounding areas. On a 14,500 kWh annual system output, that 0.7-cent rate difference adds roughly $102 per year in offset value compared to an identical system on OG&E’s grid, compounding meaningfully over a 25-year panel life. For more on this topic, see our guide to Solar Panels in Kentucky. For more on this topic, see our guide to Solar Panels in South Dakota.

PSO also uses monthly netting with a 12-month carry-forward for excess credits. One structural difference: PSO caps the statewide net metering program at 3% of the utility’s peak load. Oklahoma has not come close to that threshold — the state had just under 160 MW of installed residential solar at the end of 2025, according to SEIA — but the cap exists in the tariff and could become relevant if the state’s adoption rate accelerates. PSO also applies a 25 kW AC system size limit for residential customers, the same ceiling OG&E uses.

PSO’s interconnection timeline runs 30–90 days depending on system size and local grid conditions. The utility does not charge a recurring net metering fee beyond standard monthly service charges — a modest advantage over OG&E’s $2-per-month fixed fee. PSO’s interconnection application is filed through AEP’s online portal and works most smoothly with a NABCEP-certified installer, though NABCEP credentials are not formally required.

For customers near the OG&E/PSO service territory boundary — common in parts of the Tulsa metro — your assigned utility is determined by your physical address, not your preference. Some homeowners in transition zones have been surprised to learn their address falls under a rural electric cooperative rather than either investor-owned utility. Verifying your utility assignment with the Oklahoma Corporation Commission’s service map before signing a solar contract avoids costly surprises at the interconnection stage and ensures you’re comparing the right net metering terms.

Oklahoma Solar Payback Period: OG&E vs. PSO by the Numbers

A realistic payback calculation for a 10 kW system in Oklahoma City starts with installed cost. The national average installed cost fell to approximately $2.85 per watt in 2025, according to NREL’s annual benchmark report. At that price, a 10 kW system costs $28,500 before incentives. After the 30% federal Investment Tax Credit, net cost drops to $19,950. Oklahoma has no state-level solar income tax credit and no sales tax exemption for solar equipment, which is a meaningful gap compared to states like New Mexico or Colorado, both of which layer additional state incentives on top of the federal credit.

At OG&E’s 9.4-cent rate and 14,500 kWh of annual production, a 10 kW system offsets roughly $1,363 in annual electricity costs. A conservative 80% self-consumption rate still yields the same $1,363 in annual value, because net metering credits OG&E customers at full retail regardless of when generation occurs. The raw payback: $19,950 ÷ $1,363 = approximately 14.6 years. Apply a 2% annual electricity rate escalator — modest by historical standards — and payback shortens to around 12.8 to 13.2 years. That’s a 12- to 13-year payback on a system warrantied for 25 years, leaving more than a decade of essentially free production.

For PSO customers, the higher 10.1-cent rate produces an annual offset of about $1,465 on the same system, bringing payback to approximately 12.4 to 12.6 years. Neither figure matches the 7–9 year paybacks available in high-rate states, but both clear the warranty threshold comfortably. NREL research pegs solar’s property value premium at roughly $4 per watt of installed capacity, meaning a 10 kW system adds approximately $28,500 in resale value even before electricity savings are counted — a relevant figure for homeowners weighing a shorter ownership horizon.

Bar chart comparing solar payback periods for OG&E and PSO customers versus US average and neighboring states
Oklahoma solar payback exceeds the US median due to the state’s below-average electricity rates. An OG&E customer recoups a 10 kW system in roughly 13.2 years; a PSO customer in 12.6 years — compared with the US median of 9.8 years and Arizona’s 8.3 years. Source: NREL, EIA, SEIA 2026.

You can model your specific situation — including your actual monthly usage, OG&E or PSO rate, and local sun hours — using the solar payback calculator to generate a personalised timeline before talking to an installer.

Solar vs utility company · 25-year comparison

Total cost of staying on the grid vs owning solar for a $300/month bill (national average assumptions).

Total utility payments

$42,900

Total solar cost (after ITC)

$18,900

Net savings

+$24,000

Avg. monthly difference

+$85/mo

See my savings →

Federal Tax Credit and Oklahoma-Specific Solar Incentives

The 30% federal ITC is the single largest financial lever available to Oklahoma solar buyers. For a $28,500 system, that credit equals $8,550 — a direct reduction in federal income tax owed, not a deduction from taxable income. The credit applies to the full installed cost including labor, racking, wiring, and any battery storage added at the same time. The Inflation Reduction Act locked this 30% rate through 2032, with a step-down to 26% in 2033 and 22% in 2034, before expiring entirely in 2035 under current law. There is no household income cap; any homeowner with sufficient federal tax liability can claim the full amount.

Oklahoma’s state-level incentive landscape is sparse. The state eliminated its solar income tax credit in 2017 and as of 2026 has not replaced it, putting Oklahoma behind peer states in the incentive stack. The state does offer a property tax exemption on the added assessed value solar panels create — your annual property tax bill will not increase because of the installation. In a state with steadily rising home valuations, this prevents meaningful long-term tax drag and is worth factoring into total ownership cost.

Some rural electric cooperatives in Kansas and Oklahoma offer modest equipment rebates — typically $0.10 to $0.25 per watt — but these are co-op specific and subject to annual budget caps. Indian Electric Cooperative, for example, has offered rebates in past program years but closes enrollment once annual funding is exhausted. Checking directly with your co-op administrator before signing a contract is essential, as rebate availability changes year to year.

Oklahoma City and Tulsa do not offer municipal solar incentives as of 2026, though both cities have adopted renewable energy goals that could eventually support rebate programs. For a complete picture of how the federal ITC interacts with your system cost and tax situation, the solar tax credit calculator walks through IRS Form 5695 line by line so you can confirm your exact credit before committing to a purchase.

Is Solar a Good Investment in Oklahoma Right Now?

Oklahoma’s solar economics in 2026 sit in an honest middle ground. The state’s low electricity rates push payback periods beyond the national median, and the absence of a state tax credit means the federal ITC carries nearly all the incentive weight. At the same time, Oklahoma’s strong solar irradiance — averaging 5.5 to 6.1 peak sun hours daily — means you generate more kilowatt-hours per installed dollar than homeowners in cloudier states like Washington or Michigan. The generation advantage partially compensates for the rate disadvantage.

The homeowners who benefit most from solar in Oklahoma are those with electricity bills above $150 per month, who plan to stay in their homes for 15 or more years, and who have enough federal tax liability to capture the full $8,550 ITC on a typical 10 kW system. Households with electric vehicles or those considering a heat pump conversion also improve their solar math significantly — each additional high-consumption appliance shifted to solar-generated electricity shortens the effective payback period by reducing grid draw during peak rate hours.

Battery storage is worth considering alongside panels in Oklahoma. The state experiences more severe weather events per square mile than almost any other in the country — tornado season runs March through June, and ice storms regularly disrupt winter power supply. A battery backup system paired with solar provides resilience during outages independent of net metering economics. At current installed costs of roughly $800 to $1,000 per usable kWh of storage before the ITC, batteries in Oklahoma are less about financial return and more about energy security.

The longer-term policy risk is real but not paralyzing. If the OCC allows OG&E or PSO to shift from retail-rate net metering to avoided-cost compensation — a change that has occurred in states like Nevada and Arizona — Oklahoma solar economics would weaken noticeably. Systems installed today are typically grandfathered under existing tariff rules for 10–20 years depending on the specific OCC ruling, so current buyers are protected even if rules change for future customers. Assessing your household’s full energy picture — including potential EV adoption and heating electrification — will produce a more accurate long-term return estimate than a simple panel-only analysis.

Frequently asked questions

Direct answers for US homeowners in Oklahoma.

Solar remains a viable long-term investment in Oklahoma despite the state's 9.7-cent average electricity rate. After the 30% federal tax credit, a 10 kW system costs around $19,950 and pays back in roughly 12–14 years under OG&E or PSO net metering. With panels warrantied for 25 years, homeowners who stay in place long-term see a decade or more of near-zero electricity costs. High-consumption households — above 1,500 kWh per month — see the strongest financial returns.

Popular utility companies

Solar rules and net metering vary by utility — not just by state.

Methodology & data sources

Calculation method: System size uses NREL PVWatts derate factor (0.82). Costs based on SEIA 2026 installed cost ($2.75–$3.20/W). Payback uses net cost after 30% federal ITC (IRC Section 25D). Savings assume full-retail net metering unless noted.

Official sources: EIA state electricity rates · NREL PVWatts · Energy.gov ITC guide · DSIRE incentives · SEIA market data · IRS Publication 5695.

All figures are estimates for educational purposes — not tax, legal, or investment advice. Consult a licensed installer and CPA for your situation.

Calculate my savings →