Mississippi averages 5.0 peak sun hours per day — more than Louisiana and solidly competitive with much of the Southeast — yet the state consistently ranks near the bottom of national solar adoption surveys. In 2024, Mississippi had fewer than 8,000 residential solar installations statewide, according to SEIA, a figure that reflects real structural obstacles rather than a lack of sunshine. Understanding those obstacles honestly is the most useful thing this article can do for you before you spend $15,000 to $30,000 on a rooftop system.
The core tension here is simple: Mississippi has good solar resource, but it also has some of the cheapest electricity in the country. When your baseline electricity rate is low, the financial arithmetic of solar changes dramatically. Entergy Mississippi, the dominant utility serving the Jackson metro and much of the state, charges residential customers around 11 to 12 cents per kilowatt-hour — roughly 30 percent below the US average of about 16 cents per kWh reported by the EIA for 2024. That gap matters enormously when you are trying to calculate how long it takes to recover a large upfront investment.
This is not a reason to dismiss solar outright in Mississippi. There are households here for whom rooftop solar makes clear financial sense, particularly those with high consumption, good roof orientation, and access to financing at low interest rates. But there are also many households for whom the numbers simply do not add up, and those people deserve a straight answer rather than a sales pitch. This guide works through both scenarios.
📋 Key Insights
How Entergy Mississippi’s Rate Structure Affects Solar Economics
Entergy Mississippi operates under Mississippi Public Service Commission oversight, and its residential rate schedule is relatively straightforward compared to utilities in states like California or New York. The base residential rate sits around 11.5 cents per kWh once you include the fuel adjustment clause, which fluctuates quarterly based on natural gas prices. When gas prices spike, your utility bill rises and briefly improves solar’s payback math. When gas is cheap, as it was through much of 2023 and early 2024, the case for solar weakens.
The bigger issue for solar owners is how Entergy handles net metering. Mississippi passed a net metering law, but the implementation is less generous than what homeowners in Arizona or Massachusetts receive. Entergy Mississippi credits excess solar generation at the avoided cost rate rather than the full retail rate in many circumstances, particularly for customers on certain tariff schedules. Avoided cost — what the utility would have paid to generate or purchase that power elsewhere — is typically 4 to 6 cents per kWh, far below the retail rate you pay to consume power. If your system regularly overproduces and you are receiving credits at 5 cents rather than 11.5 cents, you recover your investment more slowly than simple payback calculators suggest. Use the solar net metering calculator to model the difference between full retail crediting and avoided-cost crediting for your specific consumption profile before signing any contract.
Entergy has also proposed and implemented fixed monthly charges for solar customers in some jurisdictions it serves across the South. Mississippi customers should verify the current interconnection tariff carefully, as these charges can add $10 to $25 per month to your fixed costs regardless of how much solar you generate, which erodes the financial benefit of a smaller system particularly quickly. A household generating 800 kWh per month in net-zero credits could find a $20 fixed solar charge consuming nearly 20 percent of the bill savings it expected.
📈 Payback Period
Mississippi Solar Payback Period: What the Numbers Actually Say
The honest payback estimate for a typical Mississippi homeowner is 12 to 16 years, based on a $25,000 gross system cost before the federal tax credit and current Entergy rates. After the 30 percent federal Investment Tax Credit under the Inflation Reduction Act, the net cost drops to around $17,500. Spread that recovery across 11.5-cent electricity savings and you arrive at roughly 13 years for a household using 1,200 kWh per month — assuming no avoided-cost crediting penalty and no fixed solar surcharges. For state-by-state payback data, our guide to Solar Panel Payback Period by State is the most complete resource. For a full price breakdown by system size and region, see our guide to How Much Do Solar Panels Cost in 2026? Complete US.
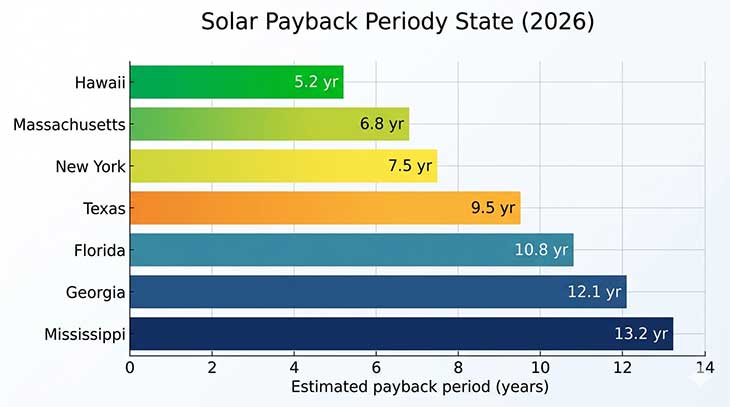
That 13-year figure compares unfavorably with payback periods in high-electricity-cost states. NREL data consistently shows states like Hawaii delivering payback under six years for comparable systems, driven entirely by higher retail electricity rates that reach 40 cents per kWh or more. Texas homeowners, despite a similar climate, often see 9 to 11 year payback periods thanks to higher average rates in deregulated markets. Mississippi sits at the long end of the national range, alongside other low-rate Southern states.
Mississippi’s solar payback period is among the longest in the nation. At approximately 13 years, Mississippi trails Hawaii (5.2 yr), Massachusetts (6.8 yr), Texas (9.5 yr), and Florida (10.8 yr) — a gap explained almost entirely by electricity rate differences. Source: NREL, EIA 2026.
That said, payback period is only one lens. A solar system installed today carries a 25-year production warranty on most premium panels. If your system pays back in 13 years, you still collect roughly 12 years of nearly free electricity — potentially $8,000 to $12,000 in value at today’s rates, and more if rates rise. Modelling different electricity rate escalation scenarios across the full 25-year panel life often produces a more compelling result than stopping at the simple payback figure.
Solar vs utility company · 25-year comparison
Total cost of staying on the grid vs owning solar for a $300/month bill (national average assumptions).
Mississippi’s Solar Incentives: Federal Credit and Not Much Else
Mississippi offers no state income tax credit for solar installation. It does provide a sales tax exemption on solar equipment, which saves roughly 7 percent on hardware costs — meaningful, but not the kind of stackable incentive structure you find in New York or New Mexico, where state credits, utility rebates, and property tax exemptions can cut effective system cost by 40 to 50 percent beyond the federal credit alone.
What Mississippi homeowners do have access to is the federal 30 percent Investment Tax Credit, which runs at full value through 2032 under current IRS guidance before stepping down to 26 percent in 2033. On a $25,000 system, that is a $7,500 direct reduction in your federal tax liability — not a deduction, a credit. You need sufficient federal tax liability to absorb it, and if your credit exceeds your liability in year one, the unused portion carries forward to subsequent years. The solar tax credit calculator helps you determine whether your tax situation allows full credit absorption and how any carry-forward affects your effective payback timeline.
Mississippi also maintains a property tax exemption for the added value solar creates on your home. A system that adds $15,000 to your appraised home value will not trigger a corresponding increase in your property tax bill. Given that Mississippi’s property tax rates are already among the lowest in the country, this exemption carries less dollar weight here than in high-property-tax states like New Jersey or Illinois. One further incentive worth investigating is the USDA Rural Energy for America Program (REAP), which provides grants and loan guarantees to agricultural producers and rural small businesses. Mississippi has significant rural and agricultural land, and farm operations with commercial solar needs may qualify for grants covering up to 25 percent of total project costs — a meaningful supplement in a state where other solar incentive layers are thin.
⚡ System Size
Sizing Your System Correctly for Mississippi Conditions
One of the most common and costly mistakes Mississippi solar buyers make is oversizing a system based on total annual consumption without accounting for the net metering penalty on export. In a state with full retail net metering — like California — you can size a system to 110 or 120 percent of your usage and receive dollar-for-dollar credits for everything you export. In Mississippi, where Entergy typically credits exports at avoided cost rates of 4 to 6 cents rather than the retail rate of 11.5 cents, exporting large volumes of power is financially inefficient and significantly extends payback.
The practical implication is that Mississippi homeowners should size systems to match their daytime self-consumption as closely as possible, not their total monthly bill. A household that uses 1,500 kWh per month but draws most of that power in the evenings — for air conditioning, cooking, and lighting after 5 p.m. — will self-consume far less than 100 percent of a system sized to that full load. NREL modeling indicates that in peak-summer Mississippi conditions, a south-facing 8 kW system generates the bulk of its output between 9 a.m. and 4 p.m., hours when many households are at work and consumption is lower.
Getting this sizing math right before purchase can reduce the effective payback period by one to three years compared to an oversized system exporting heavily at penalized rates. A good solar installer will pull 12 months of interval data from your Entergy account to map your hourly consumption profile before recommending a system size. If an installer quotes you based only on your monthly kWh total without asking about your usage timing, that is a warning sign worth probing before you commit to a $20,000-plus contract. Mississippi’s neighbors in the Southeast share this same sizing challenge under similar utility structures.
🔋 Storage & Usage
Battery Storage and Resilience in Mississippi
Battery storage adds a new financial layer to the Mississippi solar calculation, and the math here is even more challenging than for panels alone. A Tesla Powerwall 3 retails around $9,500 before installation; full installation with electrical work typically brings the total to $12,000 to $15,000 per unit. In states with time-of-use rates — where electricity costs significantly more during evening peak hours — battery storage allows homeowners to discharge stored solar during expensive periods and generate meaningful bill savings. Entergy Mississippi does not currently offer a widespread time-of-use residential rate that would reward that kind of battery dispatch economically.
Where battery storage does make clear sense in Mississippi is resilience, not bill savings. The state sits in a region that sees significant severe weather, including hurricanes affecting the Gulf Coast counties and ice storms affecting the northern parts of the state. Extended outages are a real risk, and a battery system provides genuine backup power value that is difficult to quantify financially but is not zero — particularly for households that rely on medical equipment, have young children, or operate home businesses where downtime costs money.
If you are primarily interested in backup resilience rather than bill offset, the economics of pairing a smaller solar array with storage look different than a pure payback calculation. A system sized to run essentials — refrigerator, lights, some HVAC load — during a 24 to 48 hour outage might cost $20,000 to $25,000 all-in and provide meaningful peace of mind even if the pure financial payback stretches beyond 18 years. Before committing to a battery purchase, run the numbers through the Tesla Powerwall ROI calculator to model how different outage frequencies and backup-load assumptions affect what you are actually paying per hour of resilience.
Related calculators
Free tools for US homeowners — instant results, all 50 states.
For most Mississippi homeowners, solar delivers a payback period of 12 to 16 years due to electricity rates averaging around 11.5 cents per kWh — roughly 30 percent below the US average. It makes the clearest financial sense for high-consumption households with good roof orientation and full absorption of the 30 percent federal tax credit. For average users, the math is marginal and worth modelling carefully before committing to a net investment above $17,000.
Entergy Mississippi credits excess solar generation, but the rate depends on your tariff. Many residential customers receive credits at the avoided cost rate of 4 to 6 cents per kWh rather than the full retail rate of around 11.5 cents. This significantly reduces savings from any system that regularly exports power to the grid. Always confirm your specific interconnection tariff and crediting rate with Entergy before finalising your system size.
The primary incentive is the federal Investment Tax Credit at 30 percent through 2032, worth $7,500 on a $25,000 system. Mississippi provides a sales tax exemption on solar equipment, saving roughly 7 percent on hardware, plus a property tax exemption on the added home value from solar. There is no state income tax credit. Rural agricultural operations may qualify for USDA REAP grants covering up to 25 percent of project costs.
A typical 8 kW system costs $22,000 to $28,000 before incentives in Mississippi. After the 30 percent federal tax credit, net cost drops to approximately $15,400 to $19,600. The sales tax exemption saves an additional $1,000 to $1,500 on equipment. Total effective cost for most households lands between $14,000 and $18,000 depending on installer, equipment tier, and roof complexity.
Yes. Mississippi averages 4.8 to 5.2 peak sun hours per day depending on location, with the southern Gulf Coast counties receiving the most irradiance. Panels perform reliably here. The constraint is financial rather than meteorological — low electricity rates mean each kWh of solar output has less dollar value than in higher-rate states, stretching payback even though the panels themselves produce well. *Data sources: U.S. Energy Information Administration (EIA) Electric Power Monthly, 2024; National Renewable Energy Laboratory (NREL) PVWatts Calculator and solar payback estimates, 2025; Solar Energy Industries Association (SEIA) state solar installations data, 2024; IRS Publication on the Residential Clean Energy Credit, 2025; Mississippi Public Service Commission interconnection tariff filings; USDA Rural Energy for America Program guidelines, 2025.*
Mississippi solar by electric bill
See system size and payback for common monthly bills in Mississippi.