US residential solar · 2026 data

Solar Panels in Michigan

SAVE

$0+

Over 25 Years

$18,900 Cost after ITC
15.5 yrs Payback
9.0 kW Typical system

Most homeowners need:

  • 21–25 panels typical
  • 9.0 kW average system
  • $18,900 after tax credits
  • 15.5 year payback
✓ Updated monthly ✓ NREL data ✓ Reviewed by solar experts ✓ IRS tax credit included
· 9 min read ·By ·Reviewed by Green Energy Calculators Editorial Team

Without solar vs with solar

25-year cost comparison for a $300/month US electric bill.

Without solar

25-year utility cost

$51,200

Rates rise ~3% per year (EIA avg.)

With solar

Net system cost

$18,900

After 30% federal ITC

Your savings

Difference

+$32,300

Estimated lifetime advantage

500,000+
calculations completed
25,000+
users monthly

Trusted by US homeowners · Data sourced from

NREL EIA Energy.gov DSIRE IRS / SEIA
Author Mark Sullivan
Reviewed by Green Energy Calculators Editorial Team
Last updated
Sizing formula kW = Annual kWh ÷ (Peak Sun Hours × 365 × 0.82)

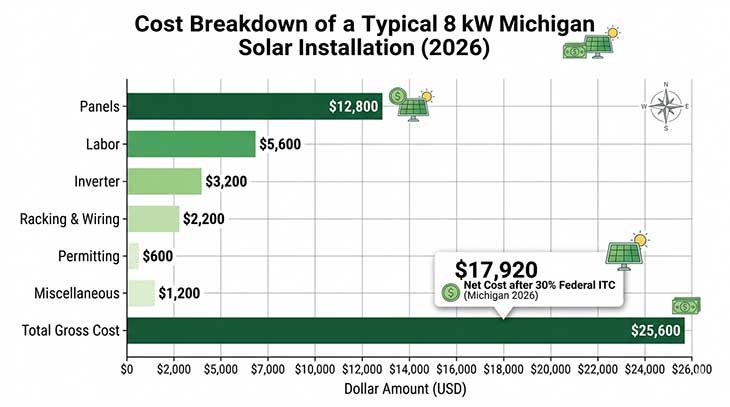
Michigan homeowners who installed solar in 2025 paid an average of $2.85 to $3.50 per watt before incentives, putting a typical 8-kilowatt system between $22,800 and $28,000 — and that’s before the 30% federal tax credit reduces the bill significantly. The state sits in the middle of the pack for solar potential: not as sunny as Arizona or California, but far more viable than most people assume. Detroit averages around 4.0 peak sun hours per day, enough to make residential solar a sound financial decision for hundreds of thousands of households.

What makes Michigan worth serious consideration in 2026 is the combination of a strong federal incentive, improved net metering rules, and rising electricity rates. The EIA reported Michigan’s average residential rate at roughly 18.2 cents per kilowatt-hour in late 2024, up about 12% over three years. That rate trajectory directly increases the value of every kilowatt your panels generate — the faster rates climb, the quicker your system pays for itself.

This guide covers real installed costs, the full stack of available incentives, the savings math, and what to watch for when collecting quotes in the Great Lakes State. Every figure here comes from publicly available sources — no estimates dressed up as guarantees.

What Solar Panels Actually Cost in Michigan in 2026

The installed price of a residential solar system in Michigan has declined steadily over the past decade, though the pace has slowed. As of early 2026, expect to pay roughly $2.85 to $3.50 per watt for a fully installed system, depending on your roof type, system size, equipment tier, and installer. SEIA data puts national residential installed costs at around $3.00 per watt, and Michigan tracks close to that midpoint.

For a typical Michigan home using 900 kWh per month — near the state average — you’d need a 7 to 9 kW system. At $3.20 per watt, an 8 kW system runs $25,600 before any incentives. After the 30% federal Investment Tax Credit, that drops to $17,920 out of pocket, assuming you have enough federal tax liability to absorb the full credit in year one. Homeowners who can’t use the entire credit immediately can carry the remainder forward to subsequent tax years.

Equipment quality affects long-term returns more than most installers emphasize. Tier-1 monocrystalline panels from manufacturers like Qcells or REC Group typically carry 25-year performance warranties and degrade at roughly 0.5% per year — meaning your system should still produce at least 87.5% of rated output after 25 years. Lower-cost panels can degrade at twice that rate, quietly compressing your savings over the system’s life.

Before contacting any installer, use the solar system size calculator to establish a realistic kilowatt target based on your monthly usage, local sun hours, and panel efficiency. Knowing your target figure before requesting quotes prevents installers from oversizing your system and inflating the total cost.

Labor in Michigan typically runs $0.50 to $0.80 per watt of installed capacity. Permitting fees vary by municipality but generally add $300 to $800. Michigan doesn’t impose a statewide solar permit surcharge, which keeps total project costs lower than in states with more restrictive local codes. Roof condition is a wildcard — a reroof required before installation can add $8,000 to $15,000 and should factor into your total cost calculation from the start.

Bar chart showing Michigan solar system cost breakdown by component in 2026
Michigan Solar System Cost Breakdown (8 kW, 2026) An 8 kW system costs $25,600 on average before incentives, dropping to $17,920 after the 30% federal ITC. Source: SEIA, IRS.

Find your exact solar savings

Enter your ZIP code for a personalized estimate using your state's electricity rate and sun hours.

Free · No signup · Uses EIA & NREL data

Michigan Solar Incentives and Tax Credits for 2026

The federal solar Investment Tax Credit is the single largest incentive available to Michigan homeowners in 2026. At 30%, it was locked in through 2032 under the Inflation Reduction Act, with a gradual step-down starting in 2033. The IRS administers the credit via Form 5695, and it applies to the full installed system cost — panels, inverters, racking, wiring, and labor all qualify. Battery storage installed alongside solar also qualifies; standalone battery additions now qualify as well, a change that took effect in 2023. For more on this topic, see our guide to Solar Panels in Washington.

At the state level, Michigan enacted significant solar policy improvements in 2023 and 2024 under its Clean Energy and Climate Action packages. The Michigan Public Service Commission updated net metering rules, expanding program access to more customer classes and raising the statewide cap from 1% to 10% of utility peak load. That expansion matters: Consumers Energy and DTE Energy had previously approached or hit the old 1% cap in some service territories, effectively freezing new installations in those areas.

Michigan also exempts the added value of a solar installation from property tax assessment. NREL research indicates solar typically increases home value by 3% to 4% — on a $25,000 system, that’s a $750 to $1,000 annual property tax exposure that Michigan homeowners avoid entirely. The state also exempts solar equipment from the 6% sales tax, saving roughly $1,200 to $1,700 on a mid-size residential system.

The IRA created additional adders — low-income community bonuses and domestic content premiums — that can push effective credit rates above 30% for qualifying projects. Most standard residential installations won’t reach the domestic content threshold in 2026, but the base 30% credit is available to virtually all Michigan homeowners with qualifying tax liability. Combined, the federal ITC plus the Michigan sales tax exemption and property tax exemption can reduce the effective net cost of an $25,600 system by more than $10,000 over the first year alone.

Use the solar tax credit calculator to estimate exactly how much of the federal ITC you can claim based on your system cost and annual tax liability.

How Much Can Michigan Homeowners Save on Electricity Bills?

The savings calculation starts with your current electricity spending and projects forward. At Michigan’s average retail rate of 18.2 cents per kWh, a homeowner consuming 10,800 kWh per year — 900 kWh per month — spends roughly $1,966 annually on electricity. A properly sized solar system can offset 80% to 100% of that usage, though net metering compensation terms determine how much credit you receive for surplus generation sent to the grid.

Under Michigan’s updated net metering policy, excess power exported to the grid earns credits at the full retail rate. That’s a meaningfully better deal than states like Nevada or Florida, which have shifted to lower avoided-cost or wholesale-rate compensation structures in recent years. Retail-rate net metering makes a well-sized Michigan solar system more valuable because every exported kilowatt offsets what you’d otherwise pay, dollar for dollar.

Over a 25-year system life, cumulative electricity savings for a Michigan homeowner offsetting 90% of usage can reach $55,000 to $70,000 in today’s dollars, assuming electricity rates rise by 3% annually — a conservative estimate given that DTE Energy and Consumers Energy have each requested multiple rate increases since 2022. That lifetime savings figure is two to four times the net-of-incentives system cost for most installations.

Savings also depend on your rate plan. Homeowners on time-of-use pricing need to account for when their panels produce versus when their household draws power. Michigan’s major utilities have expanded TOU rate options, and pairing solar with battery storage lets households shift more consumption to off-peak periods, potentially boosting annual savings by 10% to 15% compared to a solar-only installation on a standard flat rate. The solar payback calculator can show whether a battery addition makes financial sense given your specific utility rate schedule and consumption pattern.

Solar Payback Period in Michigan: Real Timelines

The payback period — the point at which cumulative electricity savings equal your upfront net cost — determines whether solar makes sense for your household finances. Under 2026 conditions in Michigan, realistic payback periods run 9 to 13 years, depending on system size, financing method, electricity rate in your utility territory, and how much of your usage the system actually offsets.

Here’s the math on a typical scenario: an 8 kW system at $25,600 gross costs $17,920 after the 30% ITC on a cash purchase. At $1,700 in annual electricity savings — based on 80% offset at 18.2 cents per kWh — the simple payback is 10.5 years. If rates rise 3% annually, that shortens to closer to 9 years. Finance the same system with a solar loan at 7% over 20 years and your monthly payment is around $140, while electricity savings start at roughly $142 per month — modestly cash-flow positive from day one, improving annually as rates increase.

Michigan’s solar irradiance is often compared unfavorably to sunnier states, but the gap is narrower than the reputation suggests. NREL’s PVWatts data shows Detroit generating approximately 4.0 peak sun hours daily, compared to 4.3 for Columbus, Ohio. That 7% difference in irradiance translates to a roughly 7% longer payback period — meaningful but not disqualifying, especially given that Michigan electricity rates are higher than Ohio’s.

Two factors compress Michigan paybacks beyond the base math: sustained utility rate escalation, which both major Michigan utilities have demonstrated over the past four years, and battery storage that captures more generated power for self-consumption rather than grid export at potentially lower future compensation rates. Homeowners in Wisconsin face similar irradiance conditions but higher average installation costs, making Michigan one of the stronger Midwest solar markets on a pure payback basis in 2026.

Solar vs utility company · 25-year comparison

Total cost of staying on the grid vs owning solar for a $300/month bill (national average assumptions).

Total utility payments

$51,200

Total solar cost (after ITC)

$18,900

Net savings

+$32,300

Avg. monthly difference

+$101/mo

See my savings →

Choosing a Solar Installer in Michigan: What to Know

Michigan has a competitive solar installation market, with roughly 80 to 100 active residential installers statewide as of 2025, ranging from national companies to regional firms and local electrician-led operations. The price range across quotes for an identical system can span $5,000 or more — getting at least three written quotes is the single most effective cost-control step available to any homeowner.

The most important credential to verify is NABCEP (North American Board of Certified Energy Practitioners) certification. Installers with NABCEP-certified designers or installers have passed a recognized industry exam. Michigan doesn’t require a specific solar contractor license beyond a standard electrical contractor license, so NABCEP certification is the clearest third-party quality signal you can check before signing anything.

Financing terms deserve as much scrutiny as the equipment quote. Solar loans offered by installers often carry rates of 5.99% to 9.99% and sometimes include a dealer fee that inflates the loan principal by 10% to 30% above the cash price — a cost that doesn’t appear on the quote sheet. Ask for the cash price and the loan’s effective APR separately before comparing offers. Homeowners with home equity often find a HELOC or home equity loan offers a lower effective rate than installer-arranged financing.

Leases and power purchase agreements reduce upfront costs to near zero but transfer most of the financial upside to the financing company. Warranty terms also vary significantly. A reputable installer should offer at least a 10-year workmanship warranty on the installation itself, separate from manufacturer warranties. Panels typically carry 25-year performance and product warranties; string inverters usually cover 10 to 12 years; microinverters are often warrantied for 25 years. Verify that the installer will still be operating to honor their workmanship warranty — a reasonable question to ask directly, with references from installations completed five or more years ago. Before signing any installer contract, run a side-by-side comparison of total 20-year costs across purchase and lease scenarios using the solar lease vs buy calculator.

Frequently asked questions

Direct answers for US homeowners in Michigan.

Yes, though not for the reason most people assume. Michigan's solar case rests on high electricity rates and strong incentives rather than exceptional sunshine. With average retail rates above 18 cents per kWh and the 30% federal ITC available through 2032, the financial math works for most homeowners. Detroit averages 4.0 peak sun hours daily — sufficient for a well-sized system to generate meaningful savings. Most Michigan homeowners see payback in 9 to 13 years.

Popular utility companies

Solar rules and net metering vary by utility — not just by state.

Methodology & data sources

Calculation method: System size uses NREL PVWatts derate factor (0.82). Costs based on SEIA 2026 installed cost ($2.75–$3.20/W). Payback uses net cost after 30% federal ITC (IRC Section 25D). Savings assume full-retail net metering unless noted.

Official sources: EIA state electricity rates · NREL PVWatts · Energy.gov ITC guide · DSIRE incentives · SEIA market data · IRS Publication 5695.

All figures are estimates for educational purposes — not tax, legal, or investment advice. Consult a licensed installer and CPA for your situation.

Calculate my savings →