Guide solar panels kentuckylge net meteringku net meteringkentucky solar incentiveskentucky solar payback 2026

Solar Panels in Kentucky: LG&E and KU Net Metering in a Low-Rate State

Kentucky's low electricity rates slow solar ROI, but LG&E and KU net metering plus the 30% federal tax credit still make solar a sound long-term investment in 2026.

 Β·  Updated  Β·  11 min read  Β·  By

Kentucky homeowners pay an average of just 10.6 cents per kilowatt-hour for electricity β€” roughly 20% below the national average of 13.2 cents, according to the U.S. Energy Information Administration (EIA). That single fact shapes every solar calculation in the state. Low rates mean each kilowatt-hour your panels generate is worth less than it would be in, say, Massachusetts or California, which stretches payback periods and trims lifetime savings. But it doesn’t make solar a bad investment β€” it makes it a different investment, one that rewards careful analysis over enthusiasm.

The other piece of the puzzle is net metering. Both Louisville Gas and Electric (LG&E) and Kentucky Utilities (KU) β€” the two dominant investor-owned utilities serving the state β€” offer net metering programs that credit your bill for surplus solar energy sent to the grid. The rate and structure of those credits directly determine how quickly a solar system pays for itself. And with the federal Investment Tax Credit (ITC) still returning 30% of installation costs to homeowners, the math is more favorable than Kentucky’s low rates might suggest at first glance.

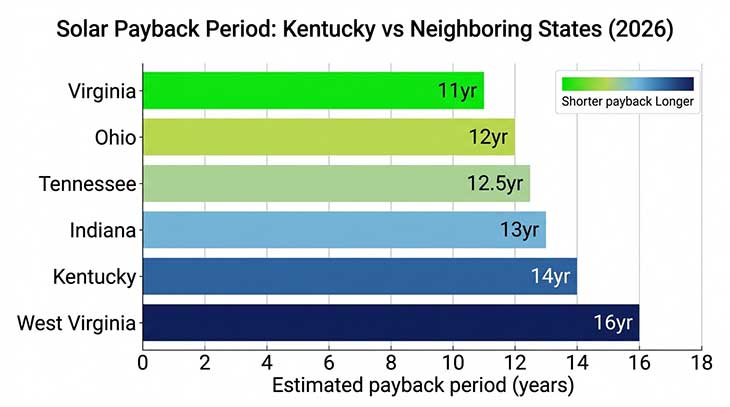
This guide breaks down everything a Kentucky homeowner needs to know: how LG&E and KU net metering actually works, what a typical system costs and saves, how payback compares to neighboring states, and what questions to ask an installer before you sign anything.

How LG&E and KU Net Metering Works

Both LG&E and KU operate under net metering rules set by the Kentucky Public Service Commission (PSC). Customers with solar systems up to 30 kW in capacity β€” which covers virtually every residential installation β€” are eligible to enroll. The utility installs a bidirectional meter that tracks both consumption and export separately, and the enrollment process typically takes four to eight weeks once your installer submits the interconnection application.

When your panels produce more electricity than your home uses, the surplus flows to the grid and you receive a credit on your bill. Under current LG&E and KU tariffs, that credit is applied at the retail rate β€” meaning you get full value for each exported kilowatt-hour, the same 10.6 cents per kWh you’d otherwise pay. This is called full retail net metering, and it’s the most homeowner-friendly version of the policy. Some states credit exports only at the lower wholesale rate, which significantly weakens the financial case for residential solar.

Credits accumulate monthly and can offset future electricity bills, but they don’t roll over indefinitely. At the end of each 12-month period, any unused credits are forfeited β€” you don’t receive a check from the utility for the excess. This means right-sizing your system matters considerably. A system that generates significantly more electricity than you use annually will waste surplus credits and reduce your effective return on investment.

One important caveat: Kentucky’s net metering policy is not locked in permanently. The PSC reviews utility tariffs periodically, and there has been ongoing debate about whether the credit rate should shift to a lower avoided-cost rate. Several neighboring states β€” including Tennessee and Indiana β€” have already reduced net metering benefits in recent years. Homeowners who install solar now under the current full-retail-rate structure are typically grandfathered in for 25 years, which is a meaningful reason to act before any policy revision arrives.

To estimate how net metering credits would accumulate on your specific roof and usage pattern, the solar net metering calculator can model different scenarios based on your monthly consumption and system size.

What Solar Costs and Saves in Kentucky

The average cost of a residential solar installation in Kentucky runs between $2.60 and $3.10 per watt before incentives, according to SEIA data. For a typical 8 kW system β€” which suits most Kentucky homes with average consumption β€” that puts gross cost in the range of $20,800 to $24,800. After the 30% federal ITC, your net out-of-pocket cost drops to approximately $14,560 to $17,360.

Kentucky does not currently offer a state income tax credit for solar installations. There is a state sales tax exemption for solar equipment, which saves homeowners roughly $1,000 to $1,500 on a standard residential system. A property tax exemption for the added home value from solar is also available, which matters because solar typically increases a home’s appraised value by $3,000 to $5,000 according to NREL research.

Annual electricity savings depend on your system size, roof orientation, and local sun hours. Kentucky averages about 4.5 peak sun hours per day β€” similar to Ohio and slightly better than West Virginia. An 8 kW system in Kentucky will typically generate around 10,000 to 11,000 kWh per year. At 10.6 cents per kWh, that comes to roughly $1,060 to $1,166 in annual bill reduction. That’s meaningful, but notably lower than what a similarly sized system would save in Florida at 12.1 cents/kWh or Virginia at 12.6 cents/kWh.

The solar savings calculator can personalize these numbers for your actual utility rate, roof size, and local sun data.

Horizontal bar chart comparing solar payback period in years for Kentucky and five neighboring states
Kentucky’s solar payback period runs longer than all five neighboring states. At an average electricity rate of 10.6 cents/kWh, Kentucky homeowners typically see payback in 13–15 years β€” compared to 11 years in Virginia and 12 years in Ohio. Source: EIA, NREL 2026.

Understanding Kentucky Solar Payback and Long-Term ROI

At current rates, a Kentucky homeowner who spends $16,000 net (after the ITC) on an 8 kW solar system and saves $1,100 annually will reach payback in approximately 14.5 years. That’s longer than the national median of roughly 10 years, and longer than what you’d see in higher-rate states. But payback period is only the beginning of the analysis.

A residential solar system carries a 25-year performance warranty, and panels typically keep producing well past that point. If electricity rates in Kentucky rise at their historical average of 2.5% per year β€” a conservative assumption by EIA projections β€” annual savings grow every year after installation. By year 20, that same homeowner would likely be saving $1,600 or more annually. The 25-year cumulative savings figure climbs to $30,000 to $38,000, representing a solid return on a $16,000 net investment even accounting for the slow early years. For more on this topic, see our guide to Solar Panels in Michigan.

NREL data indicates that the internal rate of return (IRR) on residential solar in Kentucky runs around 5% to 7% β€” lower than in premium markets but competitive with long-term bond returns and certificates of deposit. For homeowners who plan to stay in their house for 15 or more years, solar makes sound financial sense. For those who may sell in 5 to 10 years, the outcome depends heavily on whether buyers recognize the value of the system and whether the home’s appraised value reflects the solar installation.

Financing structure also shapes the math considerably. A solar loan at 7% interest may produce monthly payments that exceed bill savings for several years before reaching breakeven. Leases and power purchase agreements (PPAs) avoid upfront cost but don’t qualify for the ITC and typically deliver lower lifetime value than an outright purchase. The solar payback calculator can model all three scenarios side by side with Kentucky-specific rate inputs.

Battery Storage with Solar in Kentucky: When It Makes Sense

In most states, the main reason homeowners add a battery is to store surplus solar energy and use it during evening hours instead of exporting it at a reduced credit rate. In Kentucky, that logic is weaker than elsewhere β€” because LG&E and KU still offer full retail-rate net metering, the credit for exporting surplus power is identical to what you’d pay to import it. There’s currently no direct financial penalty for exporting, which removes one of the primary financial motivations for adding storage.

Battery storage does deliver something net metering cannot: resilience during grid outages. Kentucky experiences periodic severe weather β€” ice storms and summer thunderstorms can knock out power for hours or days. A home battery system rated at 13.5 kWh, such as the Tesla Powerwall, can keep essential loads running through most outages. For homeowners in rural LG&E or KU service areas where restoration times run longer, that resilience has real value even if it’s difficult to express in dollars per kilowatt-hour.

The financial case for battery storage strengthens if the PSC reduces the net metering credit rate in a future tariff revision. If credits drop to the avoided-cost rate β€” historically around 3 to 5 cents per kWh in Kentucky β€” self-consuming solar energy would be worth two to three times more than exporting it. Installing battery-ready wiring and inverter infrastructure at the time of your solar installation costs relatively little, typically $500 to $1,000 extra, and positions you to add storage later without a full system retrofit.

Kentucky does not currently offer a state incentive for battery storage. However, the federal 30% ITC applies to battery systems charged exclusively by solar panels β€” which covers the vast majority of residential configurations. On a $10,000 battery installation paired with solar, that represents a $3,000 federal tax credit that substantially improves the storage economics and narrows the payback gap compared to states with dedicated battery incentives.

EV Charging, Coal Grid Emissions, and Choosing a Kentucky Installer

One underappreciated dimension of solar economics in Kentucky is the interaction with electric vehicles. If you own or plan to buy an EV, your annual home electricity consumption rises significantly β€” the average EV adds 3,000 to 4,500 kWh per year in home charging demand. That changes your solar sizing calculations entirely: a system appropriate for your house alone may be too small once EV charging is factored in. The upside is that EV home charging converts previously exported credits into genuinely consumed solar energy, improving your self-consumption rate and overall ROI simultaneously.

Kentucky’s electricity grid is still heavily coal-dependent β€” roughly 65% of the state’s electricity came from coal as recently as 2024, per EIA data. From a carbon perspective, home solar in Kentucky displaces some of the highest-emission grid electricity in the country. The emissions reduction per kilowatt-hour of solar generated is meaningfully larger here than in a cleaner-grid state like Washington, making the environmental case unusually strong even when the financial payback is slower.

When evaluating installers, request itemized quotes that separately state equipment cost, labor, permit fees, and utility interconnection fees. LG&E charges a $100 interconnection application fee and KU charges a comparable amount. Ask any installer whether they handle the interconnection paperwork on your behalf β€” most established companies do, but it’s worth confirming before you sign a contract.

Comparing quotes from at least three installers is standard practice, and it’s especially important in Kentucky where the solar market is less mature than in Sun Belt states. Installer quality varies more in smaller markets, and a system that underperforms by 10% due to poor installation can add two or more years to an already-extended payback period. Before signing, run your final quote through the solar ROI calculator to confirm the numbers your installer is presenting align with realistic Kentucky production estimates.

Frequently Asked Questions

Does Kentucky have a state solar tax credit?

No, Kentucky does not offer a state income tax credit for residential solar installations. The primary incentive is the federal ITC, which returns 30% of system costs β€” a $6,000 credit on a $20,000 system. Kentucky also provides a sales tax exemption on solar equipment and a property tax exemption for the home value solar adds, saving most homeowners an additional $1,000 to $2,000 combined.

How much can I save with LG&E or KU net metering?

A typical 8 kW system generates around 10,500 kWh annually, saving approximately $1,100 per year at the current retail rate of 10.6 cents/kWh. LG&E and KU credit exports at the full retail rate. Unused credits at the end of the 12-month cycle are forfeited rather than paid out as cash. Savings increase each year as electricity rates rise over the 25-year system life.

What is the solar payback period in Kentucky?

Most Kentucky homeowners see payback in 13 to 16 years, depending on system size, roof orientation, and financing method. After the 30% federal ITC reduces net system cost to roughly $14,500 to $17,500, and with annual savings of $1,000 to $1,200, that range follows directly. Kentucky’s payback is longer than the national median of 10 years because state electricity rates run about 20% below the U.S. average.

Can I still get net metering if I install solar today?

Yes. Both LG&E and KU currently offer full retail-rate net metering to residential customers with systems up to 30 kW. Homeowners who interconnect under the current tariff are generally grandfathered for 25 years if the policy later changes. The Kentucky PSC has not announced a scheduled review targeting net metering rates, but future revisions remain possible as they have occurred in neighboring states.

Is solar worth it in Kentucky given the low electricity rates?

Solar in Kentucky produces a positive financial return over a 25-year period, though payback is slower than in high-rate states. With a 5%–7% IRR and 25-year cumulative savings of $30,000 to $38,000 on a net investment of roughly $16,000, the returns compare favorably to conservative financial instruments. Homeowners who plan to stay long-term, own or plan to buy an EV, or value energy resilience have the strongest case for going solar here.

Data sources: U.S. Energy Information Administration (EIA) Electric Power Monthly, April 2026; National Renewable Energy Laboratory (NREL) PVWatts Calculator and Solar Payback State Data 2026; Solar Energy Industries Association (SEIA) Solar Market Insight Q1 2026; IRS Publication 5695 (Residential Energy Credits); Kentucky Public Service Commission LG&E and KU net metering tariff filings.

Data sources: U.S. Energy Information Administration (EIA) electricity rates Β· National Renewable Energy Laboratory (NREL) peak sun hours Β· Solar Energy Industries Association (SEIA) installation costs Β· IRS Publication 5695 (Investment Tax Credit) Β· Database of State Incentives for Renewables & Efficiency (DSIRE). All calculations are estimates. Consult a licensed solar installer for precise quotes.