US residential solar · 2026 data

Solar Panels in Iowa: MidAmerican Energy Net Metering and the Wind vs Solar Decision

SAVE

$0+

Over 25 Years

$18,900 Cost after ITC
21.1 yrs Payback
9.0 kW Typical system

Most homeowners need:

  • 21–25 panels typical
  • 9.0 kW average system
  • $18,900 after tax credits
  • 21.1 year payback
✓ Updated monthly ✓ NREL data ✓ Reviewed by solar experts ✓ IRS tax credit included
· 9 min read ·By ·Reviewed by Green Energy Calculators Editorial Team

Without solar vs with solar

25-year cost comparison for a $300/month US electric bill.

Without solar

25-year utility cost

$37,600

Rates rise ~3% per year (EIA avg.)

With solar

Net system cost

$18,900

After 30% federal ITC

Your savings

Difference

+$18,700

Estimated lifetime advantage

500,000+
calculations completed
25,000+
users monthly

Trusted by US homeowners · Data sourced from

NREL EIA Energy.gov DSIRE IRS / SEIA
Author Mark Sullivan
Reviewed by Green Energy Calculators Editorial Team
Last updated
Sizing formula kW = Annual kWh ÷ (Peak Sun Hours × 365 × 0.82)

Iowa generates more than 60% of its electricity from wind — a fact that shapes every conversation about home solar in the state. That dominance keeps retail electricity rates low (around 11–12 cents per kilowatt-hour, well below the national average of roughly 16 cents), which stretches the payback period for solar panels compared to higher-rate states. But low rates don’t make solar a bad deal; they just require you to run the numbers honestly. With a generous 15% state solar tax credit, federal incentives, and MidAmerican Energy’s net metering program still on the table, Iowa homeowners in 2026 have real financial tools to work with — as long as they understand the rules before signing any contract.

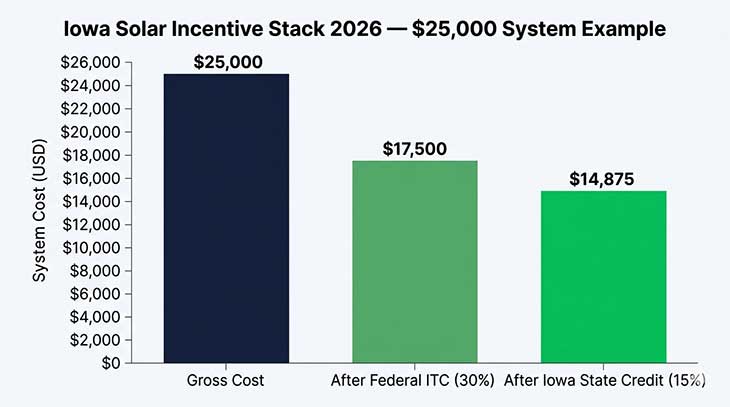
The Iowa residential solar market has grown steadily despite the headwinds from cheap wind-generated power. SEIA data shows Iowa ranked in the top half of Midwest states for cumulative solar installations by 2025, with growth driven primarily by falling panel costs and the state tax credit. The average 8–10 kW residential system installed in Iowa in 2025 ran between $22,000 and $28,000 before incentives, dropping to roughly $15,000–$19,000 after the 30% federal Investment Tax Credit and the Iowa 15% credit are applied. That out-of-pocket figure is competitive with neighboring Illinois, even with Iowa’s lower electricity rates.

Understanding where your utility stands on net metering is arguably the single most important variable in any Iowa solar decision. Two utilities dominate the state — MidAmerican Energy and Alliant Energy — and their compensation structures differ enough to affect your 25-year return materially. This article focuses primarily on MidAmerican Energy, which serves Des Moines, Davenport, and much of central and eastern Iowa, but includes comparisons where the contrast is instructive.

How MidAmerican Energy Net Metering Works in Practice

MidAmerican Energy’s net metering program credits excess solar generation at the full retail rate — currently around 11–12 cents per kWh — as long as your system is sized to meet but not significantly exceed your annual consumption. That one-to-one retail credit is the foundation of most Iowa solar payback calculations. Using the solar net metering calculator on this site, a Des Moines homeowner with a 9 kW system and a $130/month average bill can model roughly $1,200–$1,400 per year in net bill reduction at current rates.

The program requires a bi-directional meter, which MidAmerican installs at no charge to the customer. Monthly credits roll over; any remaining balance at the end of the annual cycle is paid out at the utility’s avoided-cost rate, which is lower than retail — typically 3–4 cents per kWh. That end-of-year true-up structure means over-sizing your system is a financial mistake in Iowa: you’ll generate credits you can never use at full value. Size your system to cover 95–100% of your annual usage, not 120%.

Iowa’s interconnection rules, updated in 2021, capped net metering eligibility at systems up to 500 kW for non-residential customers and effectively unlimited for residential customers under 25 kW. For a typical home system, that cap is not a practical constraint. However, MidAmerican has been among the utilities nationally that have sought to revise net metering compensation structures as solar penetration increases. Iowa homeowners are advised to confirm current tariff terms with the utility before installation, since rate cases can alter credit values between quote and commissioning.

There is no interconnection queue backlog for residential customers in Iowa as of early 2026 — most applications process within 30–45 days. That’s notably faster than utilities in high-solar states like California or Arizona, where grid saturation has created multi-month waits and curtailment concerns. Alliant Energy, the other major Iowa utility, runs a similar net metering structure but with slightly different avoided-cost true-up rates, so confirm your specific utility’s current tariff before making any financial projections.

Find your exact solar savings

Enter your ZIP code for a personalized estimate using your state's electricity rate and sun hours.

Free · No signup · Uses EIA & NREL data

Iowa Solar Tax Incentives: The 15% State Credit and Federal ITC

Iowa offers one of the more straightforward state solar incentives in the country: a 15% nonrefundable income tax credit on the net cost of a residential solar installation, capped at $5,000 per installation. The state credit is calculated on the system cost after the federal ITC is applied — meaning you can’t double-dip the same dollar. On a $25,000 gross system, the federal 30% ITC (as extended by the Inflation Reduction Act) reduces your federal tax liability by $7,500, bringing the effective cost to $17,500. Iowa’s 15% credit then applies to that $17,500 figure, yielding up to $2,625 in additional state tax reduction. To apply this credit correctly, start with a firm figure from our guide to How Much Do Solar Panels Cost in 2026? Complete US.

The combined effect is a total incentive stack of roughly 38–40% of system cost for most Iowa homeowners who have sufficient federal and state tax liability to absorb both credits in the year of installation. If your state tax liability is smaller than the credit you’ve earned, the Iowa credit carries forward for up to five additional tax years — a useful feature for retirees on fixed incomes. The solar tax credit calculator on this site can help you estimate both federal and state credit amounts based on your system cost and filing status.

Iowa does not currently have a sales tax exemption for solar equipment (unlike some neighboring states), and property tax exemption rules vary by county. In most Iowa counties, solar systems are assessed at $0 for property tax purposes under Iowa Code Chapter 427A — effectively making solar a property-tax-neutral improvement. Confirm with your county assessor before purchasing, as assessments are not uniformly applied across the state. Iowa’s incentive structure heavily favors ownership; third-party ownership arrangements such as leases and PPAs are not eligible for the 15% state credit, which makes loan-financed ownership the financially superior path for most Iowa buyers.

Bar chart comparing Iowa solar system costs before and after federal ITC and Iowa 15% state tax credit
Iowa’s incentive stack cuts a $25,000 solar system to roughly $14,875 out-of-pocket. The 30% federal ITC saves $7,500 and Iowa’s 15% state credit adds $2,625 more — a combined reduction of 40% from gross price. Source: IRS, Iowa Department of Revenue, SEIA 2026.

Wind vs Solar: What the Numbers Actually Show for Iowa Homeowners

The wind vs solar framing is slightly misleading for most Iowa residents — homeowners cannot install a residential wind turbine and expect economics comparable to utility-scale wind farms. Small residential wind turbines (typically 1–10 kW) require average wind speeds above 10–11 mph at hub height, unobstructed exposure, and significant upfront cost — usually $15,000–$75,000 depending on system size and tower height. NREL data shows average wind speeds in central Iowa hovering around 8–9 mph at 30 meters, which is workable but toward the lower end for reliable residential generation. In most suburban or urban Iowa settings, solar is the more practical and cost-effective option by a significant margin.

For rural Iowa landowners with significant open acreage, a small wind turbine can be a genuine competitor to rooftop solar — particularly if the roof is shaded, aging, or north-facing. Iowa Code Chapter 476C provides a production tax credit for wind energy, though it has historically been targeted at commercial-scale producers. Residential wind installations in Iowa are eligible for the federal 30% ITC under the same rules as solar, which helps close the cost gap. Tower installation, permitting, setback requirements, and ongoing maintenance costs add complexity that rooftop solar avoids entirely.

For the vast majority of Iowa homeowners in town, rooftop solar wins on simplicity, cost, and available incentives. A properly sized 8–10 kW solar system in Des Moines generates approximately 10,000–12,000 kWh per year — enough to cover the average Iowa household’s consumption of around 10,600 kWh annually, per EIA data. Solar panels carry 25-year performance warranties, require virtually no maintenance, and add no noise concerns. Iowa’s consistent solar resource — NREL’s PVWatts tool confirms Des Moines receives roughly 4.5 peak sun hours per day on average — provides reliable year-round generation even in the upper Midwest.

At current Iowa electricity rates and MidAmerican’s net metering credit, a typical Iowa homeowner with a $25,000 system and full incentives can expect a payback period of 11–14 years — longer than the national average of 8–9 years, but well within the system’s 25-year productive life. Over that full term, a household saving $1,300 per year nets more than $32,000 in cumulative electricity cost reductions at today’s rates, before accounting for any future rate increases. For state-level payback data with the ITC applied, see our guide to Solar Panel Payback Period by State.

How Iowa Solar Compares to Neighboring Midwest States

Iowa’s solar economics fall in the middle of the Midwest pack, with the 15% state tax credit acting as the primary differentiator. Nebraska has historically had some of the most restrictive net metering rules in the region, making Iowa more attractive by comparison despite similar electricity rates around 11 cents per kWh. Wisconsin offers a modest Focus on Energy rebate program on top of the federal ITC but lacks a direct state income tax credit comparable to Iowa’s 15% offering. Missouri has no statewide solar tax credit at all, making Iowa homeowners near the state line noticeably better positioned financially.

Minnesota presents the strongest competition to Iowa in the Midwest solar incentive landscape. Minnesota’s Solar*Rewards program and community solar options give residents multiple pathways to reduce costs, and Xcel Energy’s value-of-solar tariff provides stable long-term compensation that removes some policy risk inherent in traditional net metering. Minnesota’s slightly higher average electricity rate of around 13–14 cents per kWh also tightens payback periods compared to Iowa, partially offsetting the absence of a standalone state income tax credit equivalent to Iowa’s.

The key takeaway from these regional comparisons is that Iowa’s 15% state tax credit is the state’s primary solar advantage. It’s one of the more generous direct state credits in the Midwest and meaningfully offsets the disadvantage of low retail electricity rates. Homeowners in states without a state credit, even those with higher electricity rates, sometimes find their payback periods comparable to Iowa’s once all variables are modeled — because incentive stacks matter as much as electricity rates. The right comparison always comes down to your specific home’s consumption, your roof’s solar resource, your tax liability, and your utility’s current net metering terms.

SEIA’s 2025 state solar data confirms Iowa’s installation pace has accelerated over the past three years, with the residential segment growing faster than commercial in the 2023–2025 period — likely reflecting both the enhanced federal ITC and growing awareness of the state credit among Iowa homeowners. To model your specific scenario before meeting with an installer, the solar savings calculator lets you input your current bill, roof details, and tax situation for an Iowa-specific estimate.

Frequently asked questions

Direct answers for US homeowners in Iowa.

Yes. MidAmerican Energy offers net metering to residential solar customers, crediting excess generation at the full retail rate of around 11–12 cents per kWh. Credits roll over monthly, with any year-end surplus paid at the avoided-cost rate of 3–4 cents per kWh. Systems must be under 25 kW for residential eligibility. Most Iowa residential interconnection applications process within 30–45 days of submission.

$86/month electric bill by state

System size and payback vary by electricity rate and sun hours — see your state.

Compare all 50 states for $86/mo →

Popular state solar guides

Electricity rates and incentives vary — see data for your state.

View all 50 states →

Popular utility companies

Solar rules and net metering vary by utility — not just by state.

Methodology & data sources

Calculation method: System size uses NREL PVWatts derate factor (0.82). Costs based on SEIA 2026 installed cost ($2.75–$3.20/W). Payback uses net cost after 30% federal ITC (IRC Section 25D). Savings assume full-retail net metering unless noted.

Official sources: EIA state electricity rates · NREL PVWatts · Energy.gov ITC guide · DSIRE incentives · SEIA market data · IRS Publication 5695.

All figures are estimates for educational purposes — not tax, legal, or investment advice. Consult a licensed installer and CPA for your situation.

Calculate my savings →