US residential solar · 2026 data

Solar Panels in Florida

SAVE

$0+

Over 25 Years

$18,900 Cost after ITC
14.7 yrs Payback
9.0 kW Typical system

Most homeowners need:

  • 21–25 panels typical
  • 9.0 kW average system
  • $18,900 after tax credits
  • 14.7 year payback
✓ Updated monthly ✓ NREL data ✓ Reviewed by solar experts ✓ IRS tax credit included
· 10 min read ·By ·Reviewed by Green Energy Calculators Editorial Team

Without solar vs with solar

25-year cost comparison for a $300/month US electric bill.

Without solar

25-year utility cost

$54,300

Rates rise ~3% per year (EIA avg.)

With solar

Net system cost

$18,900

After 30% federal ITC

Your savings

Difference

+$35,400

Estimated lifetime advantage

500,000+
calculations completed
25,000+
users monthly

Trusted by US homeowners · Data sourced from

NREL EIA Energy.gov DSIRE IRS / SEIA
Author Mark Sullivan
Reviewed by Green Energy Calculators Editorial Team
Last updated
Sizing formula kW = Annual kWh ÷ (Peak Sun Hours × 365 × 0.82)

Florida homeowners installed more than 220,000 solar systems in 2024 alone, and the pace is accelerating heading into 2026. The Sunshine State averages 5.67 peak sun hours per day — one of the highest figures in the continental US — which means solar panels here produce meaningfully more electricity than they would in cloudier states like Oregon or Michigan. For a typical Florida household, that translates to annual savings between $1,400 and $1,800 on electricity bills once a system is paid off.

The financial case has never been stronger. Federal tax credits, a permanent state sales-tax exemption, and a solid net metering framework all stack together to bring the real out-of-pocket cost well below the sticker price. That said, the details matter enormously — the right system size, the right financing structure, and a clear-eyed view of your utility’s policies will determine whether your investment performs as advertised or falls short of expectations.

This guide lays out current costs, realistic savings projections, every meaningful incentive available in 2026, and the practical questions most Florida homeowners forget to ask before signing a contract.

What Does a Solar System Cost in Florida in 2026?

The average gross cost of a residential solar installation in Florida sits around $2.85 to $3.20 per watt before incentives, according to data compiled by the Solar Energy Industries Association (SEIA). For a typical 8-kilowatt system — sized to cover most of the energy use of a 2,000-square-foot Florida home — that puts the pre-incentive price between $22,800 and $25,600.

After applying the 30% federal Investment Tax Credit (ITC), which remains available through 2032 under the Inflation Reduction Act, the net cost drops to roughly $15,960 to $17,920. Florida also permanently exempts residential solar equipment from the state’s 6% sales tax, saving another $1,368 to $1,536 on an average system. Florida further exempts the added value of a solar installation from property tax assessments, so your annual property tax bill stays flat even as your home’s resale value increases.

Running those credit calculations before committing to a financing structure is essential, because homeowners who don’t owe enough in federal taxes in a single year can carry the ITC forward. The solar tax credit calculator walks through the ITC math based on your system cost and federal tax liability so you can plan accordingly.

Installation labour, permitting, and electrical upgrades typically add $2,000 to $4,500 to the total, and prices vary more than most homeowners expect across Florida’s 67 counties. Urban markets like Miami-Dade and Broward tend to run slightly higher than rural areas in the Panhandle. Getting at least three competing quotes is the single most effective way to avoid overpaying.

Compared to Arizona, where lower labour costs push prices closer to $2.60 per watt, Florida sits in the mid-range nationally — but the higher sun exposure compensates. The most efficient approach is to size your system correctly before you start shopping. The solar system size calculator uses your monthly kWh consumption and local sun hours to recommend an accurate system size, which prevents both over-buying and leaving savings on the table.

Bar chart showing Florida solar system cost before and after federal tax credit and sales tax exemption in 2026
Florida Solar System Cost Before and After Incentives (2026) A typical 8 kW system priced at $24,200 falls to approximately $16,600 after the 30% ITC and Florida’s 6% sales tax exemption. Source: SEIA Q4 2025 cost benchmarks.

Find your exact solar savings

Enter your ZIP code for a personalized estimate using your state's electricity rate and sun hours.

Free · No signup · Uses EIA & NREL data

How Much Can Florida Homeowners Actually Save?

Savings depend on three variables: how much electricity you use, what you pay per kilowatt-hour, and what your utility pays you for surplus power fed back to the grid. Florida’s average residential electricity rate in early 2026 is approximately 13.2 cents per kWh, according to the U.S. Energy Information Administration (EIA). That is modest by national standards, but Florida households consume an average of 1,150 kWh per month — about 24% more than the national average — largely because of aggressive air conditioning use in a climate that runs hot eight or nine months a year.

A well-sized 8 kW system in central Florida will produce roughly 10,800 to 11,500 kWh annually, covering the majority of a typical household’s consumption. At current rates, that equals $1,425 to $1,518 in annual savings before accounting for net metering credits. With net metering, excess power exported during sunny midday hours is credited against power drawn from the grid in the evenings, improving the effective return further.

Running the numbers on your specific bill and location is exactly what the solar savings calculator is built for — it factors in local rates, your roof’s orientation, and shading to produce a personalised annual savings estimate. Using that estimate alongside a payback projection will show you the precise break-even year, which for most Florida homeowners currently falls between 8 and 11 years on a cash purchase.

One factor that consistently surprises homeowners is how much electricity rate escalation improves the long-term return. EIA data shows Florida retail electricity prices have risen an average of 2.8% annually over the past decade. On a system purchased in 2026, that compounding rate increase means your fixed-cost solar electricity becomes progressively cheaper relative to grid power every year, pushing 20-year net savings well above initial projections. A homeowner who saves $1,500 in year one and faces 2.8% annual rate increases will accumulate roughly $40,000 in gross bill savings over 25 years before subtracting the system’s net cost.

Solar also pairs well with EV ownership, which is growing rapidly in Florida. Homeowners who charge an electric vehicle at home can use surplus daytime solar production to offset overnight charging costs. If you export more than 30% of your system’s output, a battery or an EV charger optimised for solar self-consumption can measurably improve your overall return without any change to the panel array itself.

Florida Solar Incentives and Tax Exemptions in 2026

Three layers of financial support make solar particularly attractive in Florida compared with most other states.

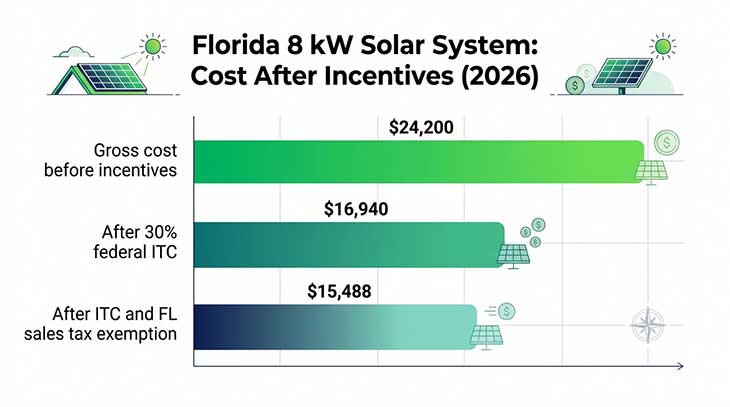
Federal Investment Tax Credit (ITC): The 30% ITC remains the most valuable incentive available. On a $24,000 system, it produces a $7,200 credit against federal income tax owed. The IRS administers this through Form 5695, and it applies to the full installed cost including labour, equipment, and permitting fees. There is no income cap and no maximum system size limit for residential installations. Homeowners who install battery storage alongside solar can also claim the credit on the battery cost, provided the battery is charged exclusively from solar.

Florida Sales Tax Exemption: Under Florida Statute §212.08, solar energy systems and components are permanently exempt from the state’s 6% sales and use tax. There is no scheduled sunset date, unlike many state-level incentives that require periodic legislative renewal. On a $25,000 system, the exemption saves approximately $1,500 that homeowners in states without similar policies must pay at purchase.

Property Tax Exemption: Florida’s Ad Valorem Tax Exemption under Section §196.175 means the assessed value of your home does not increase due to a solar installation. For a system that adds $15,000 to $20,000 in resale value — a figure supported by Lawrence Berkeley National Laboratory research — this saves Florida homeowners between $150 and $250 annually in avoided property tax, depending on their county millage rate.

Net Metering: Florida law requires investor-owned utilities including FPL, Duke Energy Florida, and TECO to offer net metering at the full retail rate, crediting excess solar generation at the same price the utility charges for electricity. This policy is currently under review by the Florida Public Service Commission, and homeowners who install in 2026 will be grandfathered under current rates for at least 20 years. Acting now provides meaningful protection against any future policy changes.

Local and Utility Incentives: Several Florida co-ops and municipal utilities offer additional rebates ranging from $500 to $1,500 per installation. These programs vary significantly by territory and are worth verifying with your utility directly before installation. DSIRE, the national database of state energy incentives, maintains an up-to-date registry of utility-level programs across Florida for homeowners researching local solar rebates in their service territory.

Financing a Florida Solar Installation: Cash, Loan, Lease, or PPA?

How you pay for solar affects your total return almost as much as the system itself. Each structure carries genuine advantages and real trade-offs that are worth understanding before you talk to an installer.

Cash purchase delivers the highest long-term return. You capture the full 30% ITC as a tax credit, own the system outright, and see an immediate reduction in your electricity bills from day one. NREL data suggests cash buyers in Florida see 20-year net savings averaging $18,000 to $26,000, depending on system size and electricity rate escalation. The payback period typically runs 8 to 11 years, after which every dollar of electricity you generate is pure return on your investment.

Solar loans allow homeowners to go solar with $0 down and still claim the ITC — unlike a lease or PPA, where the installer owns the system and keeps the tax credit. Secured home-equity solar loans typically carry rates between 6% and 9% in 2026. Unsecured solar loans run higher, often 8% to 14%. The solar loan calculator computes your monthly payment, total interest cost, and net savings across different loan terms so you can compare structures side by side with your own numbers.

Solar leases and PPAs remove upfront cost entirely, but you surrender the ITC and property-tax benefits to the installer who owns the system. Monthly payments are fixed or escalate at 1% to 3% annually. For homeowners who cannot use the ITC due to insufficient tax liability — retirees on a fixed income, for instance — a lease or PPA can still deliver modest bill savings without capital outlay. The solar lease vs. buy calculator models both options with your actual electricity rate and usage so the comparison is grounded in real numbers rather than installer projections.

The choice between a loan and a lease is rarely straightforward. Households planning to sell within five years, or those with complex tax situations, may find a PPA more practical despite the lower long-term return. Everyone else is typically better served by ownership — the gap in lifetime savings between owning and leasing commonly exceeds $10,000 over 25 years. Comparing Texas and Florida financing trends, both states have seen a significant shift toward loan-financed ownership since 2023 as installer competition has driven down loan origination fees and local credit unions have entered the solar lending market with rates 1% to 2% below national lenders.

Before requesting any installer quotes, run your projected numbers through the solar loan calculator to establish a firm monthly payment ceiling — installers regularly present financing that looks attractive in the first year but compounds unfavourably beyond year seven.

Adding Battery Storage to a Florida Solar System

Battery storage has moved from an optional add-on to a practical consideration for Florida homeowners, driven primarily by the state’s vulnerability to hurricanes and the grid outages that follow. A single Tesla Powerwall 3 carries a retail price around $9,500 to $11,200 installed, while a whole-home backup solution using two units runs $18,000 to $22,000 before incentives. The 30% ITC applies to battery storage installed alongside solar, reducing those figures by roughly $2,850 to $6,600 depending on configuration.

The financial return on batteries in Florida is more nuanced than the return on panels alone. Florida’s investor-owned utilities do not currently offer time-of-use (TOU) rates widely, which limits the bill-arbitrage opportunity that makes storage highly profitable in states like California where peak electricity costs two to three times the off-peak rate. Without a TOU structure, a battery’s economic value in Florida is primarily resilience — keeping lights on and refrigerators running through a multi-day storm — rather than a pure bill-reduction play.

For a family that has experienced three or more multi-day outages in the past five years, the value proposition is clear. For a homeowner in a part of Florida with a stable grid and no TOU option, the payback on storage alone stretches to 15 to 20 years on straight financial terms. That extended payback does not mean batteries are the wrong choice — for many Florida households, the non-financial value of uninterrupted power during hurricane season is worth the premium on its own terms.

One scenario where storage clearly pays in Florida is for homeowners on net metering who want to maximise self-consumption by storing midday surplus rather than exporting it to the grid. If you export more than 40% of your solar production, adding storage will almost certainly improve your overall return. Verify your existing inverter’s compatibility with your preferred battery brand before purchasing equipment or signing any contract. Use the solar savings calculator to model your projected export percentage as a starting point before requesting battery quotes from installers.

Frequently asked questions

Direct answers for US homeowners in Florida.

A typical 8 kW system in Florida costs $22,800 to $25,600 before incentives. The 30% federal ITC reduces that by $6,840 to $7,680, bringing the net cost to $15,960 to $17,920. Florida's sales tax exemption saves an additional $1,300 to $1,500. After all available incentives, most Florida homeowners pay between $15,000 and $18,000 out of pocket on a cash purchase.

$124/month electric bill by state

System size and payback vary by electricity rate and sun hours — see your state.

Compare all 50 states for $124/mo →

Popular state solar guides

Electricity rates and incentives vary — see data for your state.

View all 50 states →

Popular utility companies

Solar rules and net metering vary by utility — not just by state.

Methodology & data sources

Calculation method: System size uses NREL PVWatts derate factor (0.82). Costs based on SEIA 2026 installed cost ($2.75–$3.20/W). Payback uses net cost after 30% federal ITC (IRC Section 25D). Savings assume full-retail net metering unless noted.

Official sources: EIA state electricity rates · NREL PVWatts · Energy.gov ITC guide · DSIRE incentives · SEIA market data · IRS Publication 5695.

All figures are estimates for educational purposes — not tax, legal, or investment advice. Consult a licensed installer and CPA for your situation.

Calculate my savings →