US residential solar · 2026 data

Solar Panels in Delaware: Small State, Strong SREC Market, Surprising Payback

SAVE

$0+

Over 25 Years

$16,800 Cost after ITC
17.0 yrs Payback
8.0 kW Typical system

Most homeowners need:

  • 18–22 panels typical
  • 8.0 kW average system
  • $16,800 after tax credits
  • 17.0 year payback
✓ Updated monthly ✓ NREL data ✓ Reviewed by solar experts ✓ IRS tax credit included
· 10 min read ·By ·Reviewed by Green Energy Calculators Editorial Team

Without solar vs with solar

25-year cost comparison for a $300/month US electric bill.

Without solar

25-year utility cost

$41,600

Rates rise ~3% per year (EIA avg.)

With solar

Net system cost

$16,800

After 30% federal ITC

Your savings

Difference

+$24,800

Estimated lifetime advantage

500,000+
calculations completed
25,000+
users monthly

Trusted by US homeowners · Data sourced from

NREL EIA Energy.gov DSIRE IRS / SEIA
Author Mark Sullivan
Reviewed by Green Energy Calculators Editorial Team
Last updated
Sizing formula kW = Annual kWh ÷ (Peak Sun Hours × 365 × 0.82)

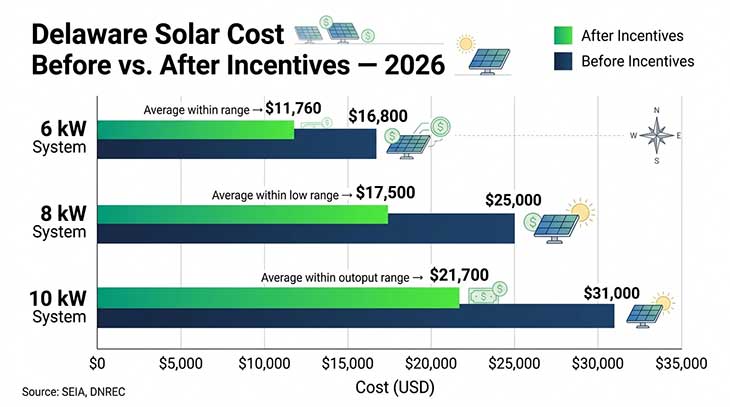
Delaware homeowners who install solar panels in 2026 can expect to pay $2.80 to $3.40 per watt installed before incentives, putting a typical 8 kW residential system between $22,400 and $27,200 — and that’s before the federal tax credit cuts the bill by 30%. The state ranks in the upper-middle tier nationally for solar economics: electricity rates hover near 17.2 cents per kWh according to the U.S. Energy Information Administration (EIA), which is meaningfully higher than the national average and makes the financial case for solar straightforward for most households.

The First State may be small in size, but it punches above its weight for solar policy. Delaware was one of the earliest states to establish a renewable portfolio standard, and that long track record has produced a stable net metering framework, an active solar renewable energy credit (SREC) market, and utility-level incentives that neighboring Pennsylvania and Maryland have only recently started to match. Understanding how these pieces fit together is what separates homeowners who get a genuinely good deal from those who sign a contract before doing the math.

This guide covers what solar actually costs in Delaware right now, which incentives apply in 2026, how long payback realistically takes, and what to confirm before committing to a system.

What Solar Panels Cost in Delaware in 2026

A well-quoted solar installation in Delaware currently runs between $2.80 and $3.40 per watt installed, based on data aggregated by the Solar Energy Industries Association (SEIA) for the Mid-Atlantic region. For the most common system size — 7 to 9 kW, which covers the average Delaware household’s electricity use of roughly 900 kWh per month — that works out to a gross cost of $19,600 to $30,600 before any incentives are applied.

Several factors push your specific quote toward the high or low end of that range. Premium monocrystalline panels (typically 400W or higher output) cost more upfront but produce meaningfully more electricity per square foot, which matters if your roof space is limited. Labor rates in Wilmington and suburban New Castle County tend to run 8–12% higher than quotes from contractors serving Sussex County. Roof complexity, electrical panel upgrades, and permit fees can add $800 to $2,500 to a base quote.

After applying the federal Investment Tax Credit (ITC) — which remains at 30% through 2032 under the Inflation Reduction Act — that 8 kW system priced at $25,000 drops to an effective cost of $17,500. Homeowners who also qualify for Delaware’s Green Energy Program grant can reduce out-of-pocket costs further.

Bar chart showing Delaware solar panel system costs before and after incentives for 6kW, 8kW, and 10kW systems in 2026
Delaware Solar System Costs Before and After Incentives (2026) An 8 kW system drops from $25,000 to $17,500 after the 30% ITC and DNREC grant. Source: SEIA, DNREC.

If you’re comparing a cash purchase to a solar loan, the total cost difference over 20 years can be $6,000 to $12,000 depending on interest rate — use the solar loan calculator before signing to see the full interest cost and whether a loan beats your current electricity bill from day one.

Find your exact solar savings

Enter your ZIP code for a personalized estimate using your state's electricity rate and sun hours.

Free · No signup · Uses EIA & NREL data

Delaware Solar Incentives and Rebates for 2026

Delaware’s incentive structure layers three programs on top of the federal ITC, and knowing each one’s mechanics prevents you from leaving money on the table.

Federal Investment Tax Credit (ITC): At 30%, this remains the most valuable incentive available. A homeowner with a $24,000 system claims a $7,200 credit directly against their federal income tax liability. The credit is non-refundable — if your tax liability is less than $7,200 in year one, the remainder carries forward to subsequent tax years. IRS Form 5695 is the filing vehicle for this credit, and the IRS allows carryforward for as many years as needed until the credit is fully consumed.

Delaware Green Energy Program: The Delaware Department of Natural Resources and Environmental Control (DNREC) runs a grant program for residential solar installations. As of 2026, residential systems up to 25 kW are eligible for $0.10 per watt, capped at $1,000 for systems 10 kW and under. The program operates on a first-come, first-served basis with annual funding caps — applying early in the calendar year maximizes your chances of receiving the full grant. DNREC publishes application windows on its official website, and funds have historically been exhausted within the first half of each calendar year. To apply this credit correctly, start with a firm figure from our guide to How Much Do Solar Panels Cost in 2026? Complete US. For more on this topic, see our guide to Solar Panels in Texas.

Solar Renewable Energy Credits (SRECs): Delaware operates within the PJM GATS tracking system, and Delaware utilities must source a portion of their power from solar specifically. This creates demand for SRECs, which residential system owners generate at one SREC per 1,000 kWh produced. Delaware SREC prices in 2025–2026 have traded in the $15 to $35 range. A typical 8 kW system producing 9,000 kWh per year generates roughly 9 SRECs annually — worth $135 to $315 per year in passive income.

Sales and Property Tax Exemptions: Delaware exempts solar equipment from the state’s 4.5% sales tax, saving roughly $1,000 on an average system. Solar installations are also excluded from property tax assessments, meaning your home’s increased value from solar won’t raise your annual tax bill. According to NREL research, solar adds an average of $4 per watt to a home’s resale value — on an 8 kW system, that’s approximately $32,000 in added home equity shielded from property tax in Delaware.

How Delaware’s Net Metering Policy Works

Net metering is the mechanism that makes rooftop solar financially viable — it determines what happens to the excess electricity your panels produce during the day. Delaware’s net metering rules, administered through the Public Service Commission, are among the more favorable in the Northeast.

Under Delaware’s current policy, excess electricity sent to the grid earns you a credit at the full retail electricity rate — approximately 17.2 cents per kWh for most residential customers in 2026. That full retail credit matters: some states such as New York and California have shifted to crediting excess generation at a lower avoided-cost rate, which materially changes the economics. Delaware has not made that change as of this writing.

Credits accumulate monthly and roll forward indefinitely. Delmarva Power and Delaware Electric Cooperative — the two primary utilities serving most of the state — both participate in the program. At the end of a 12-month period, any remaining surplus credit is paid out at the avoided cost rate, which is lower than retail. The practical implication: size your system to cover your annual usage without significantly overproducing, since over-generation earns a lower compensation rate.

Getting the system size right is the single most important step in maximizing net metering value. An oversized system in Delaware generates credits faster than you can use them, and the year-end avoided-cost payout is typically 40–50% below the retail rate — a gap large enough to affect your overall return meaningfully. NREL’s PVWatts tool, using Wilmington climate data, shows that a properly sized 8 kW system will offset approximately 9,600 kWh per year, closely matching the average Delaware household’s annual consumption of around 10,800 kWh.

Homeowners adding battery storage can optimize further by storing midday excess locally and drawing on it during evening peak hours, which Delmarva Power’s time-differentiated rate schedules reward. Delaware’s net metering framework has remained stable since 2009, giving homeowners reasonable confidence that the policy structure will persist through the typical 10–12 year payback window for most systems installed today.

Solar Payback Period and Long-Term Savings in Delaware

For an 8 kW system with a net cost of roughly $16,500 after the federal ITC and DNREC grant, the average Delaware homeowner can expect a solar payback period of 8 to 11 years — and a 25-year net savings of $25,000 to $40,000, depending on how electricity rates change over time. The EIA’s historical data shows Delaware retail electricity prices have increased at an average annual rate of about 2.5% per year over the past decade, and solar locks in your generation cost at zero marginal cost for the life of the panels.

System production in Delaware averages around 1,100 to 1,250 kWh per kW installed per year, according to NREL’s PVWatts modeling for the Wilmington area. That figure is lower than Arizona or Florida — Delaware gets about 4.2 peak sun hours per day on average — but Delaware’s higher electricity rates compensate substantially. The value of each kWh your panels produce is higher here than in a sunnier but cheaper-rate state.

Degradation is the primary long-term factor to account for. Quality silicon panels lose roughly 0.5% output capacity per year, meaning an 8 kW system producing 9,600 kWh in year one produces closer to 8,400 kWh in year 25. That’s already baked into most reputable payback projections, but worth confirming with your installer. A 25-year linear performance warranty from a Tier 1 manufacturer is standard and should be non-negotiable in your contract.

SREC income adds a layer of return that is easy to overlook. At $15 to $35 per SREC and 9 SRECs per year for a typical 8 kW system, a homeowner who actively sells SRECs through a registered aggregator could recoup an additional $1,350 to $3,150 over a 10-year period — shaving one to two years off the payback timeline without any additional investment. For homeowners also driving an EV, the savings calculation improves further — rooftop solar effectively provides home charging at the equivalent of under $1.00 per gallon of gasoline. Use the solar payback calculator to model your system cost, annual production, and electricity rate escalation together before committing to any installer quote.

Solar vs utility company · 25-year comparison

Total cost of staying on the grid vs owning solar for a $300/month bill (national average assumptions).

Total utility payments

$41,600

Total solar cost (after ITC)

$16,800

Net savings

+$24,800

Avg. monthly difference

+$80/mo

See my savings →

Is Solar Worth It in Delaware? Key Considerations Before You Sign

For most Delaware homeowners, the financial case for solar in 2026 is solid — but the outcome depends heavily on how well the system is designed and priced. A few factors determine whether you land in the strong-return or marginal-return category.

Electricity usage matters more than sunlight. Delaware’s average residential customer uses around 900 kWh per month, and a correctly sized system should offset 90–100% of that usage. Households using less than 500 kWh per month may see payback stretch toward 13 years even with all incentives applied, because the base electricity bill is simply lower.

Roof orientation and shading are critical inputs. South-facing roofs at a 30–35 degree pitch produce optimal output in Delaware’s latitude range. East- or west-facing roofs lose roughly 10–15% of potential production. Heavy shading from trees or neighboring structures can reduce output by 20–40%, which installers should model with shade analysis software — ask to see the report before signing.

Installer quality affects both price and production. SEIA data consistently shows a 15–20% variance in installed cost quotes for identical systems across the Mid-Atlantic region. Getting three quotes from NABCEP-certified installers is the baseline standard. Check that each quote uses the same panel wattage and inverter type so comparisons are accurate.

Lease and PPA agreements transfer most financial benefits away from you. Under a solar lease or power purchase agreement, the installer — not you — claims the federal ITC, the DNREC grant, and the SRECs. The monthly payment structure can still save money on your bill, but the 25-year savings are typically 40–60% lower than a cash or loan purchase. Comparing ownership structures carefully before signing is essential.

Permits and interconnection timelines in Delaware typically run 4 to 8 weeks from contract signing to energization, shorter than many Mid-Atlantic states. Delmarva Power’s interconnection process for systems under 10 kW is streamlined, and most experienced installers manage it without delays. Delaware’s 2021 Renewable Energy Portfolio Standards update committed the state to 40% renewable electricity by 2035, signaling continued policy support for residential solar.

Before committing to any installer quote, use the solar savings calculator to model your Delaware electricity rate, full incentive stack, and projected 25-year return side by side.

Frequently asked questions

Direct answers for US homeowners in Delaware.

An average 8 kW residential system in Delaware costs approximately $25,000 before incentives. After applying the 30% federal ITC ($7,500), the DNREC Green Energy Program grant (up to $1,000), and the 4.5% sales tax exemption (roughly $1,000), most homeowners end up with an effective net cost between $15,500 and $17,500. Your final figure depends on roof conditions, panel brand, and installer pricing in your county.

$95/month electric bill by state

System size and payback vary by electricity rate and sun hours — see your state.

Compare all 50 states for $95/mo →

Popular state solar guides

Electricity rates and incentives vary — see data for your state.

View all 50 states →

Popular utility companies

Solar rules and net metering vary by utility — not just by state.

Methodology & data sources

Calculation method: System size uses NREL PVWatts derate factor (0.82). Costs based on SEIA 2026 installed cost ($2.75–$3.20/W). Payback uses net cost after 30% federal ITC (IRC Section 25D). Savings assume full-retail net metering unless noted.

Official sources: EIA state electricity rates · NREL PVWatts · Energy.gov ITC guide · DSIRE incentives · SEIA market data · IRS Publication 5695.

All figures are estimates for educational purposes — not tax, legal, or investment advice. Consult a licensed installer and CPA for your situation.

Calculate my savings →