US residential solar · 2026 data

Solar Panels in Colorado: Altitude Bonus, Xcel Energy Rates, and the $1,500 Tax Credit

SAVE

$0+

Over 25 Years

$16,800 Cost after ITC
14.5 yrs Payback
8.0 kW Typical system

Most homeowners need:

  • 18–22 panels typical
  • 8.0 kW average system
  • $16,800 after tax credits
  • 14.5 year payback
✓ Updated monthly ✓ NREL data ✓ Reviewed by solar experts ✓ IRS tax credit included
· 11 min read ·By ·Reviewed by Green Energy Calculators Editorial Team

Without solar vs with solar

25-year cost comparison for a $300/month US electric bill.

Without solar

25-year utility cost

$49,000

Rates rise ~3% per year (EIA avg.)

With solar

Net system cost

$16,800

After 30% federal ITC

Your savings

Difference

+$32,200

Estimated lifetime advantage

500,000+
calculations completed
25,000+
users monthly

Trusted by US homeowners · Data sourced from

NREL EIA Energy.gov DSIRE IRS / SEIA
Author Mark Sullivan
Reviewed by Green Energy Calculators Editorial Team
Last updated
Sizing formula kW = Annual kWh ÷ (Peak Sun Hours × 365 × 0.82)

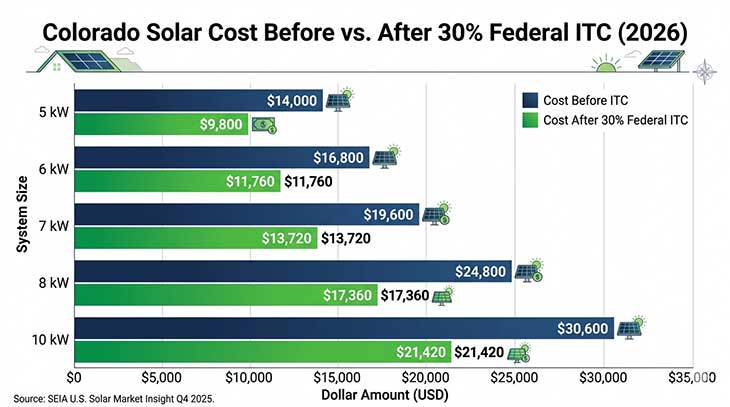
Colorado homeowners installing solar in 2026 face an average gross system cost of $28,000–$34,000, but after the 30% federal Investment Tax Credit and Colorado-specific programs, most households bring that figure down to $18,000–$22,000. That $10,000-plus gap matters enormously when deciding whether panels make financial sense for your roof. The state ranks among the top 15 in the US for solar potential, thanks to its 300-plus days of sunshine per year, and residential installations have climbed steadily since Colorado’s net metering law was strengthened in 2023.

The math behind a solar decision is straightforward in principle but depends heavily on your utility rate, roof orientation, and financing choice. Colorado’s average residential electricity rate sits around 14–15 cents per kilowatt-hour according to the U.S. Energy Information Administration (EIA) — lower than coastal states like California or Massachusetts, which means your dollar-for-dollar savings take a little longer to accumulate. Still, most Colorado homeowners see payback periods of 8–11 years, and a 25-year system lifespan means more than a decade of near-free electricity after that.

This guide covers what a typical system actually costs in Colorado in 2026, which incentives you can stack, how net metering works with your specific utility, and the questions most homeowners forget to ask their installer before signing a contract.

What Does a Solar System Cost in Colorado in 2026?

The installed price for a residential solar system in Colorado averages $2.80–$3.40 per watt before any credits, according to installer data compiled by the Solar Energy Industries Association (SEIA). For a typical Colorado home using around 10,000 kilowatt-hours per year, that translates to a 7–9 kilowatt system and a gross cost of roughly $19,600–$30,600. The midpoint of that range — a standard 8 kW system at $3.10 per watt — runs about $24,800 before any incentives are applied.

Several factors push your specific number up or down. Roof complexity is one of the biggest variables — a simple south-facing gable roof costs less to work on than a hip roof with multiple dormers. Panel brand and efficiency tier matter too: budget panels from Tier 2 manufacturers run about 15–20% cheaper than premium options like SunPower or REC, but they also carry shorter warranties and lower output guarantees. Inverter type adds another layer; string inverters are cheapest, while microinverters cost $1,000–$2,000 more for an average system but perform better in partial-shading situations common in Denver’s mature tree canopy neighborhoods.

Labor costs in the Front Range (Denver, Boulder, Fort Collins, Colorado Springs) run slightly higher than rural areas due to permitting complexity and contractor demand. Jefferson County and Larimer County both have relatively efficient permitting offices, while some mountain communities in the high country can add 4–6 weeks to your project timeline. Permitting fees across Colorado counties range from $150 to over $600 depending on jurisdiction, a detail worth factoring into your comparison quotes before you finalize a budget.

Battery storage is increasingly popular in Colorado, particularly in areas prone to grid outages during winter storms. Adding a single Tesla Powerwall — currently priced at around $11,500 installed — bumps your total project cost significantly, but the battery also qualifies for its own share of the 30% federal ITC. If backup power is a priority, run the numbers carefully before committing to a specific battery configuration, since the financial case for storage depends heavily on your utility’s time-of-use rates and local outage frequency.

Before calling installers, it helps to know roughly how large a system you need. The solar system size calculator estimates the kilowatts required based on your monthly electricity bill and location. Getting that number right before collecting quotes prevents the common problem of being sold an oversized system that produces far more than you can use under your utility’s net metering cap.

Bar chart showing Colorado solar system costs by size from 5 kW to 10 kW in 2026, before and after the 30% federal ITC
Colorado Solar System Costs Before and After Incentives (2026) A 7–9 kW system — the most common size for Colorado homes — costs $19,600–$30,600 gross and $13,720–$21,420 after the 30% federal ITC. Source: SEIA U.S. Solar Market Insight Q4 2025.

Find your exact solar savings

Enter your ZIP code for a personalized estimate using your state's electricity rate and sun hours.

Free · No signup · Uses EIA & NREL data

Federal and Colorado State Solar Incentives in 2026

The federal solar Investment Tax Credit sits at 30% through 2032 under the Inflation Reduction Act, making it the single largest incentive available to Colorado homeowners. On a $26,000 system, that’s $7,800 back as a direct reduction in your federal tax liability — not a deduction, but a dollar-for-dollar credit. If you can’t use the full credit in one year because your tax bill is lower than $7,800, you can carry the remainder forward to the following tax year. The IRS governs this credit under Form 5695, and both the panels and any battery storage installed at the same time qualify for the full 30%.

At the state level, Colorado does not offer a separate state income tax credit for residential solar as of 2026, but two programs meaningfully reduce costs. The Colorado Sales Tax Exemption removes the state’s 2.9% sales tax from all solar equipment purchases. On a $25,000 installation, that saves roughly $725 upfront — not enormous, but real money you don’t have to finance. The Property Tax Exemption is arguably more valuable over the long run: Colorado exempts 100% of the added home value attributable to solar from property tax assessment, meaning your annual property tax bill won’t rise even though your home is worth more. DSIRE (Database of State Incentives for Renewables & Efficiency) maintains current program details and confirms both exemptions remain active in 2026.

Xcel Energy, the largest utility in the state, runs the Solar*Rewards program, which pays a per-kilowatt-hour incentive for energy you send back to the grid. The current rate has declined over previous years as more customers have enrolled, but it still adds cash flow in the early years of system ownership. Black Hills Energy and several rural electric cooperatives have their own net metering tariffs with varying rates — always verify with your specific utility before finalizing your savings estimate. Colorado Nevada and Texas all maintain retail-rate net metering for investor-owned utility customers, though program details differ.

For a comprehensive look at what you’re eligible for under the Inflation Reduction Act beyond just solar, the IRA rebate calculator covers heat pumps, insulation, and other home upgrades that can be combined with solar in the same tax year. If you’re comparing a cash purchase against a loan, the solar loan calculator lets you model different interest rates and terms to see how financing affects your total cost of ownership and monthly cash flow from day one.

How Net Metering Works in Colorado

Colorado’s net metering law requires investor-owned utilities to credit customers at the full retail rate for any excess solar electricity sent to the grid. That policy means every kilowatt-hour you overproduce on a sunny afternoon is worth the same as one you buy back from the grid on a cloudy morning — currently around 14–15 cents for most Xcel Energy customers. Under Colorado’s rules, credits carry forward monthly and are reconciled at an annual true-up each spring.

In practice, most Colorado solar homeowners are net producers in summer and net consumers in winter, given the seasonal variation in daylight hours and heating loads. The annual true-up process lets credits accumulate during June through August, when a 7 kW system can generate 900–1,100 kilowatt-hours per month, then draws those credits down through December and January. Homeowners who size their systems to match annual consumption — rather than monthly peaks — typically see the best financial outcome under net metering rules. NREL’s PVWatts modeling tool confirms that a properly sized Denver system can offset 90–100% of annual electricity consumption through net metering alone.

A few important caveats apply. Virtual net metering for community solar subscribers uses a slightly different rate structure that varies by utility and subscription tier. Rural electric cooperative members are not covered by the statewide net metering mandate and should verify their co-op’s specific policy before investing — some cooperatives offer billing credits at avoided-cost rates, which are considerably lower than retail. And if you add a battery system, the way your utility treats battery dispatch varies by tariff and is worth clarifying in writing before installation.

States with the strongest net metering protections, such as New Jersey and Oregon, tend to see shorter payback periods because every exported kilowatt-hour retains full value indefinitely. Colorado’s retail-rate compensation is more generous than states that have moved to avoided-cost crediting, but the policy landscape continues to evolve and future rate changes remain possible. The solar net metering calculator can model your expected annual credit accumulation based on your system size, utility rate, and seasonal usage profile, giving you a realistic baseline before you sign an installation contract.

Solar Payback Period and Long-Term ROI in Colorado

Based on average Colorado figures — a $26,000 system, 30% federal ITC, $725 sales tax exemption, and Xcel’s retail net metering rate — the net cost after incentives comes to roughly $17,525. Divided against annual electricity bill savings of $1,600–$2,000 (depending on pre-solar usage and rate tier), the simple payback period lands at 9–11 years for a cash purchase. Homeowners with monthly electricity bills above $175 often see payback closer to 8 years.

That calculation assumes electricity rates stay flat, which history suggests is conservative. The EIA projects residential electricity prices will rise at roughly 2–3% annually nationwide over the next decade. NREL modeling shows that Colorado homeowners who installed solar in 2015 have seen their savings grow each year as utility rates climbed — by year 10, many are saving 20–30% more annually than their original estimates projected.

The 25-year internal rate of return (IRR) for a cash-purchased Colorado solar system typically runs 8–12%, which compares favorably with the historical long-run return of a broad stock index. For homeowners who finance, the comparison shifts: if your loan rate exceeds 6–7%, the financed IRR narrows considerably. Lease and PPA structures eliminate upfront cost but also eliminate most of the long-term financial upside, since you don’t own the system or qualify for the federal ITC.

Arizona homeowners see slightly shorter payback periods due to higher annual irradiance and electricity rates, but Colorado’s combination of strong retail net metering and the property tax exemption makes it consistently competitive in NREL’s state-by-state analysis. The 25-year savings on an average Colorado system — accounting for 0.5% annual panel degradation and 2.5% annual rate escalation — typically total $45,000–$65,000 in avoided electricity costs over the life of the panels.

Use the solar ROI calculator to build a 25-year projection specific to your system size, financing method, and utility rate. It accounts for panel degradation, rate escalation, and any Solar*Rewards incentive payments, giving you a complete picture of your investment before you commit.

Solar vs utility company · 25-year comparison

Total cost of staying on the grid vs owning solar for a $300/month bill (national average assumptions).

Total utility payments

$49,000

Total solar cost (after ITC)

$16,800

Net savings

+$32,200

Avg. monthly difference

+$95/mo

See my savings →

Choosing the Right Installer and Financing for Colorado Solar

The quality of your installer matters as much as the quality of your panels. Colorado has more than 200 licensed solar contractors, and prices for identical equipment can vary by 20–30% between competing quotes. Getting at least three bids is the most reliable way to avoid overpaying. Look for installers certified by the North American Board of Certified Energy Practitioners (NABCEP) — that credential requires passing a rigorous exam and documenting field experience, and it’s the closest thing the industry has to a standardized quality benchmark.

Financing options in 2026 include cash purchase, solar-specific loans, home equity products, leases, and power purchase agreements (PPAs). Cash gives the highest lifetime return and the full federal ITC benefit. Solar loans from specialized lenders typically run 5.99–8.99% APR for well-qualified borrowers on 10–25 year terms, and you still own the system and claim the ITC. Home equity lines of credit can offer lower rates if you have substantial equity, though they place your home at risk in a way an unsecured solar loan does not.

Leases and PPAs require no money down and shift maintenance responsibility to the installer, but you forfeit the ITC and often sign a 20–25 year contract with an annual payment escalator of 1–3%. Homeowners who plan to sell within 10 years or who have limited federal tax liability sometimes find these structures practical, but the long-term financial case is weaker than ownership. In states like Florida and Georgia, PPAs are common because of aggressive installer marketing, but Colorado’s strong ownership incentives make buying — cash or financed — the better choice for most households.

When vetting quotes, confirm that the contractor pulls all required permits and files for interconnection on your behalf. Unpermitted systems can create complications when you sell your home and may void manufacturer warranties. Ask every bidder for three Colorado references from installations completed in the past 18 months, and verify that the company carries both general liability and workers’ compensation insurance. The solar lease vs. buy calculator can compare ownership paths using your specific numbers, so you can see clearly which option builds more household wealth over a 20-year horizon.

Frequently asked questions

Direct answers for US homeowners in Colorado.

For a typical 8 kilowatt system with a gross installed cost of $26,000, the 30% federal ITC reduces your tax bill by $7,800, and the state sales tax exemption saves roughly $725. Net cost after those incentives is approximately $17,475. Solar loans spread this cost over 10–20 years, with many homeowners seeing near-neutral or positive monthly cash flow when loan payments are offset by electricity bill savings from day one.

$112/month electric bill by state

System size and payback vary by electricity rate and sun hours — see your state.

Compare all 50 states for $112/mo →

Popular state solar guides

Electricity rates and incentives vary — see data for your state.

View all 50 states →

Popular utility companies

Solar rules and net metering vary by utility — not just by state.

Methodology & data sources

Calculation method: System size uses NREL PVWatts derate factor (0.82). Costs based on SEIA 2026 installed cost ($2.75–$3.20/W). Payback uses net cost after 30% federal ITC (IRC Section 25D). Savings assume full-retail net metering unless noted.

Official sources: EIA state electricity rates · NREL PVWatts · Energy.gov ITC guide · DSIRE incentives · SEIA market data · IRS Publication 5695.

All figures are estimates for educational purposes — not tax, legal, or investment advice. Consult a licensed installer and CPA for your situation.

Calculate my savings →