Solar panels lose roughly 0.5% of their output every year — which sounds minor until you do the math over a 25-year warranty period. A system producing 10,000 kWh in year one will generate only about 8,800 kWh by year 25, assuming the industry-average degradation rate tracked by the National Renewable Energy Laboratory (NREL). That’s a 12% reduction in lifetime energy production, and it has real consequences for your long-term electricity savings and return on investment.
Most homeowners focus on upfront cost and payback period when shopping for solar, but degradation rate is arguably the more important number. A panel that degrades at 0.3% annually instead of 0.7% annually will produce significantly more energy over its lifetime — and that gap compounds in the same way interest does. Over 25 years, the difference between a high-quality panel and a budget option can easily exceed 10,000 kWh of lost generation, which translates to hundreds or even thousands of dollars depending on your local electricity rate.
Understanding solar panel degradation doesn’t require an engineering degree. This guide walks through what causes panels to degrade, how to read manufacturer warranty data, what the real-world numbers look like by panel type, and how degradation should factor into your financial calculations before you sign anything.
What Causes Solar Panels to Lose Output Over Time
Solar panels degrade for several interconnected reasons, all tied to the physical and chemical stress they endure year after year. The most significant factor is UV exposure. Ultraviolet radiation gradually breaks down the polymer encapsulant that surrounds the silicon cells, causing a process called delamination — where layers of the panel begin to separate. Once moisture finds its way into those micro-gaps, cell performance drops noticeably.
Thermal cycling is the second major driver. Panels heat up during the day and cool overnight, and this daily expansion and contraction creates micro-cracks in the silicon cells themselves. These cracks, invisible to the naked eye, reduce the electrical pathways through the cell and lower output. In climates with extreme temperature swings — places like Arizona or Colorado where desert heat meets cold mountain nights — thermal cycling stress is more pronounced than in moderate coastal climates.
Potential-induced degradation (PID) is a third cause that only became widely understood in the last decade. It occurs when voltage leaks through the panel’s frame into the cells, reducing output by as much as 30% in severe cases. Better grounding, anti-PID coatings, and higher-quality encapsulants have made this much less common in modern panels, but it remains a real risk with cheaper products.
Finally, soiling — the accumulation of dirt, dust, bird droppings, and pollen — can reduce output by 1–7% in areas with low rainfall. While soiling isn’t technically degradation (output recovers after cleaning), it compounds the effect of permanent cell degradation and makes total-output calculations messier. NREL research distinguishes between these two effects, but for a homeowner’s purposes, both reduce the kilowatt-hours you’re actually generating.
Quality of materials matters enormously here. Panels using PERC (Passivated Emitter and Rear Cell) or TOPCon cell technology show measurably lower degradation rates than older polycrystalline designs, which is one reason premium panel brands command higher prices and justify it with stronger long-term production guarantees. Choosing the right cell technology at the point of purchase is one of the few decisions that permanently locks in your system’s 25-year output ceiling.
Average Solar Panel Degradation Rates by Panel Type
The industry benchmark for solar panel degradation is 0.5% per year, derived from long-term field studies published by NREL. But that number masks significant variation between panel types and manufacturer quality tiers.
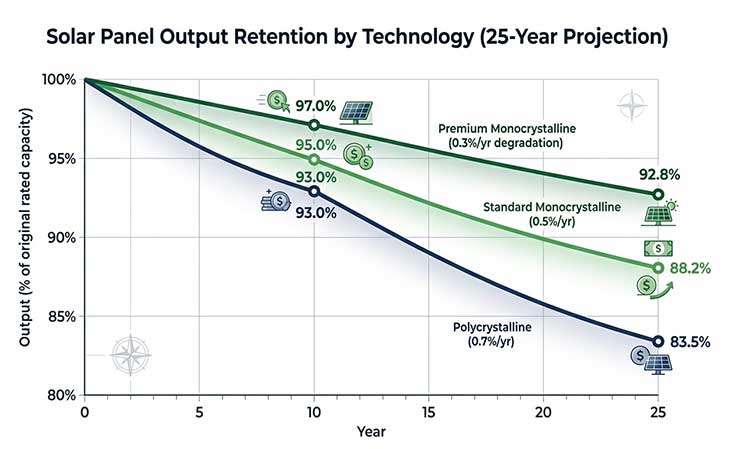
Premium monocrystalline panels from top-tier brands — the kind that carry a 0.25–0.30% annual degradation guarantee in their product warranty — will retain around 92% of their rated output after 25 years. A standard monocrystalline panel degrading at 0.5% annually will deliver roughly 88% of original output at year 25. Older polycrystalline panels, once the industry standard, typically degraded at 0.7–0.8% per year and are now largely phased out of new residential installations. For more on this topic, see our guide to Solar Panel IRR.
Where you live also influences observed degradation. Panels in Hawaii and Florida — high UV, high humidity environments — tend to show faster encapsulant breakdown than panels installed in dry climates like Nevada. A 2022 NREL field study of over 50,000 residential systems found that climate zone accounted for as much as 0.15 percentage points of difference in annual degradation rate, which sounds small but adds up to nearly 4% of lifetime output over 25 years.
When comparing quotes, look beyond the efficiency rating printed on the spec sheet and go straight to the product warranty’s “year 25 guaranteed output” figure. The Solar Energy Industries Association (SEIA) recommends treating anything below 80% at year 25 as a red flag. Premium manufacturers now commonly guarantee 87–92% at year 25, which reflects genuine advances in cell technology over the past five years. That guaranteed floor is the single most useful number for comparing panels across different brands and price points.
How Degradation Affects Your Lifetime Savings and Payback Period
The financial impact of degradation is more significant than most solar quotes make clear. To understand it properly, you need to think in total lifetime kilowatt-hours rather than first-year production numbers — and that requires factoring degradation into the math from the start.
Take a 10 kW system in Texas, where the average retail electricity rate is around $0.14 per kWh (EIA, 2025). In year one, that system might produce 14,000 kWh. With a 0.5% annual degradation rate, by year 10 it produces roughly 13,300 kWh, and by year 25 about 12,300 kWh. Over the full 25-year warranty period, total lifetime generation is approximately 330,000 kWh — not 350,000 kWh as a zero-degradation estimate would suggest. At $0.14/kWh, that 20,000 kWh gap represents $2,800 in lost electricity value.
If you ran the same numbers with a premium panel degrading at 0.3% annually, the lifetime output rises to approximately 337,000 kWh — recovering about $980 of that gap. That math is often enough to justify paying $500–$1,000 more upfront for higher-quality panels, particularly in high-electricity-rate states like Massachusetts or California, where rates can exceed $0.25/kWh and make every saved kilowatt-hour far more valuable.
Degradation also stretches your payback period. If a solar estimate models a 7-year payback using first-year production figures without accounting for annual output decline, the real payback is closer to 7.5–8 years. That’s not a crisis — solar still makes solid financial sense — but it’s a meaningful difference when comparing it against a solar loan’s interest costs. Running your numbers through a solar payback calculator that includes a degradation input gives you a far more realistic timeline. For state-by-state payback data, our guide to Solar Panel Payback Period by State is the most complete resource.
A solar ROI calculator can show you how the premium-panel vs. budget-panel decision plays out over 20–25 years when electricity rate escalation and annual degradation are both modeled together. For most households in states with rates above $0.18/kWh, the lifetime ROI difference between a 0.3% and a 0.5% degradation panel exceeds the upfront price premium within 12–15 years. Insist on seeing a production estimate that applies annual degradation across the full warranty period — any reputable installer can generate this in minutes.
Reading the Solar Panel Performance Warranty
Solar panel warranties come in two parts, and most homeowners conflate them. The product warranty (also called the materials warranty) covers manufacturing defects — typically 10–15 years. The performance warranty is the degradation guarantee — it specifies what minimum output percentage the panel must maintain after a set number of years, usually 25.
Performance warranties are not all created equal. A warranty that guarantees “80% at year 25” with only an endpoint guarantee is very different from one that guarantees “97% in year one, then no more than 0.5% decline per year thereafter.” The first structure protects you only at the endpoint — a panel could drop to 83% by year two and still technically meet the warranty if it recovers to 80% by year 25. The second, linear structure defines the permissible decline for every single year and is far more homeowner-friendly.
NREL and SEIA both recommend looking for linear performance warranties from manufacturers with a proven track record of honoring claims. Warranty claims require the manufacturer to still be in business, which is one reason buying from an established brand matters beyond product quality alone. Several manufacturers that entered the US market aggressively in the 2010s have since ceased US operations, leaving their warranties effectively void.
Also check who backs the warranty. Some manufacturers assign warranty obligations to a separately capitalized subsidiary rather than the parent company. If that subsidiary dissolves, your warranty goes with it. Ask your installer for documentation showing the warranty is backed directly by the parent manufacturer or a third-party insurer — not a shell entity.
One more term to understand: “first-year degradation.” Many panels lose 1–2% in the first year — called initial light-induced degradation — before settling into their long-term annual rate. A warranty that advertises 0.5% annual degradation may actually allow a 2% drop in year one and 0.5% thereafter, resulting in meaningfully lower lifetime output than the headline number suggests. Premium manufacturers now offer warranties with no first-year cliff, guaranteeing no more than 0.25% decline from day one. Before signing a contract, use a solar savings calculator to model the real 25-year output using the exact degradation rate stated in the warranty document itself.
How to Compare Panels Using Degradation Rate Data
Knowing that degradation rates vary between 0.25% and 0.8% per year is useful only if you know how to apply those numbers to a real purchasing decision. The right approach is to build a simple lifetime output comparison using the guaranteed degradation rate from each panel’s performance warranty — not the average rate or the marketing headline.
Start with the installer’s estimated first-year production figure for your roof, measured in kWh. Multiply that by 25 to get an uncorrected lifetime total. Then apply a degradation correction factor: for a 0.5% annual rate, multiply by 0.878; for 0.3%, multiply by 0.927; for 0.7%, multiply by 0.832. These factors account for compounding decline across all 25 years and give you apples-to-apples lifetime output figures for each panel option on the table.
Once you have lifetime kWh for each option, multiply by your current electricity rate — available from EIA state-by-state data — to arrive at a dollar value of total lifetime generation. If the higher-quality panel produces an additional 12,000 kWh over 25 years and your rate is $0.20/kWh, that’s $2,400 in additional electricity value. Compare that figure against the price difference between the two panels and the math either justifies the upgrade or it doesn’t.
Climate also factors into the comparison. In states with very high UV exposure like New Mexico or high ambient humidity like Georgia, the real-world gap between a premium and standard panel’s degradation tends to widen over time beyond what the warranty floor guarantees, because better encapsulants and cell coatings handle environmental stress more consistently. Independent testing from NREL’s outdoor exposure datasets confirms that premium panels outperform their warranty minimums more reliably in harsh climates than budget alternatives do.
Finally, factor in resale value. Homes with solar systems that carry strong, transferable performance warranties — particularly those guaranteeing 87% or more of original output at year 25 — command measurably higher sale premiums in states with active solar markets, according to SEIA residential market data. A 25-year linear warranty from a financially stable manufacturer is a transferable financial asset that adds to your home’s appraised value, not just a piece of paper filed in a drawer.
Frequently Asked Questions
What is the average solar panel degradation rate?
The industry average is 0.5% per year, according to long-term field data from NREL. Premium monocrystalline panels from top manufacturers now commonly degrade at 0.25–0.35% annually. At 0.5% per year, a panel retains about 88% of its original output after 25 years. At 0.3% per year, that rises to roughly 93%. The lifetime energy production difference for a 10 kW system is typically 7,000–10,000 kWh over 25 years.
How much output will my solar panels lose after 10 years?
At the average degradation rate of 0.5% per year, panels lose approximately 4.9% of their original output by year 10 — so a system rated at 10 kW performs at about 9,510 watts of effective capacity. Higher-quality panels degrading at 0.3% annually retain closer to 97% of original output at the 10-year mark. Most manufacturers guarantee at least 90% output at year 10 in their performance warranty documentation.
Does extreme heat speed up solar panel degradation?
Yes. High temperatures accelerate encapsulant breakdown and thermal cycling stress. NREL data shows panels in hot, humid climates degrade around 0.1–0.15 percentage points per year faster than the national average. This doesn’t make solar a poor investment in warm regions — it means accounting for slightly lower long-term output in your financial model. A lower temperature coefficient rating on the spec sheet indicates better heat tolerance and slower heat-related degradation.
What’s the difference between a product warranty and a performance warranty?
A product warranty covers manufacturing defects, typically for 10–15 years. A performance warranty guarantees minimum output levels over time — usually 25 years — and is the document that directly addresses degradation. Look for a linear performance warranty specifying maximum annual decline, such as 0.5% per year, rather than one that only guarantees a single endpoint value like “80% at year 25,” which offers weaker year-by-year output protection.
Does cleaning solar panels slow degradation?
Cleaning removes soiling — dirt, bird droppings, pollen — which causes temporary output loss rather than permanent cell degradation. Regular cleaning once or twice a year in dusty climates can recover 1–7% of output lost to soiling, but it does not reverse UV- or thermal-cycling-related cell degradation. In regions with regular rainfall, panels are largely self-cleaning and manual washing rarely adds enough recovered output to justify the cost.
Data sources: National Renewable Energy Laboratory (NREL), “Photovoltaic Degradation Rates — An Analytical Review,” 2022; U.S. Energy Information Administration (EIA), Electric Power Monthly, 2025; Solar Energy Industries Association (SEIA), Solar Industry Research Data, 2025.