US residential solar · 2026 data

Solar Panel Cost After Tax Credit

SAVE

$0+

Over 25 Years

$16,800 Cost after ITC
9.3 yrs Payback
8.0 kW Typical system

Most homeowners need:

  • 20–24 panels typical
  • 8.0 kW average system
  • $16,800 after tax credits
  • 9.3 year payback
✓ Updated monthly ✓ NREL data ✓ Reviewed by solar experts ✓ IRS tax credit included
· 10 min read ·By ·Reviewed by Green Energy Calculators Editorial Team

Without solar vs with solar

25-year cost comparison for a $300/month US electric bill.

Without solar

25-year utility cost

$75,000

Rates rise ~3% per year (EIA avg.)

With solar

Net system cost

$16,800

After 30% federal ITC

Your savings

Difference

+$58,200

Estimated lifetime advantage

500,000+
calculations completed
25,000+
users monthly

Trusted by US homeowners · Data sourced from

NREL EIA Energy.gov DSIRE IRS / SEIA
Author Mark Sullivan
Reviewed by Green Energy Calculators Editorial Team
Last updated
Sizing formula kW = Annual kWh ÷ (Peak Sun Hours × 365 × 0.82)

The federal solar Investment Tax Credit (ITC) cuts 30% directly off your federal tax bill — meaning a $28,000 system nets you an $8,400 credit, bringing your out-of-pocket cost to roughly $19,600 before any state programs apply. That single number reshapes the financial case for solar more than any other variable, yet most homeowners still quote only the gross price when comparing installers. Understanding what you actually pay after every layer of incentive is applied is the difference between a smart purchase and an expensive surprise.

As of 2026, the average residential solar installation in the US runs $2.90 to $3.50 per watt before incentives, according to NREL data. For a typical 8 kW system, that means a gross cost of $23,200 to $28,000. After the 30% federal ITC, your net cost lands between $16,240 and $19,600. Add state tax credits, utility rebates, and net metering value, and the effective price in high-incentive states can fall another $2,000 to $6,000.

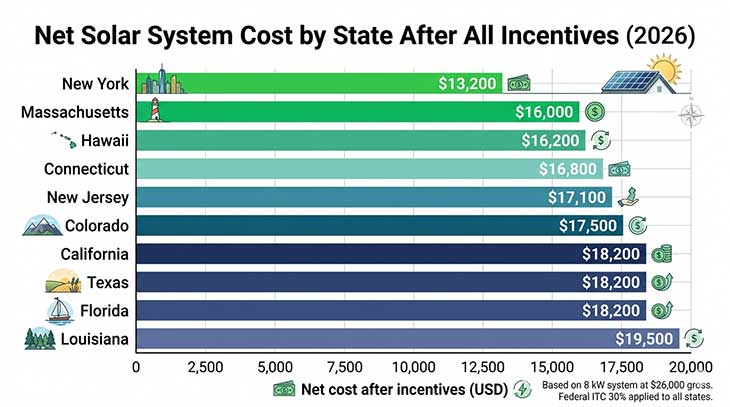
This article breaks down net solar costs state by state, explains which additional programs stack on top of the federal credit, and shows you how to calculate what you will actually pay. The numbers vary sharply — a homeowner in Massachusetts faces a different financial picture than one in Texas — so geography matters as much as system size.

How the 30% Federal Tax Credit Works

The Inflation Reduction Act extended and expanded the residential clean energy credit through 2032 at 30%, dropping to 26% in 2033 and 22% in 2034 before expiring in 2035 for residential installations. This is a tax credit, not a deduction — it reduces your federal income tax liability dollar for dollar. If your credit exceeds your tax bill for the year, the IRS allows you to carry the unused portion forward to future tax years.

To claim it, you file IRS Form 5695 with your return for the year your system was installed and placed in service. The credit applies to equipment costs, labor, permitting fees, and battery storage systems installed alongside solar panels. A standalone battery installed without solar does not qualify for the residential credit, though it may qualify under commercial provisions if used for business.

One common misconception: the ITC does not directly lower your installer invoice. You pay the full gross price at signing, then recover the 30% when you file taxes. Homeowners who finance their system should plan their loan around the gross amount and use the tax credit windfall to make a lump principal payment. Our solar tax credit calculator lets you enter your system cost and estimated tax liability to see exactly how much you recover and over how many tax years.

The credit also covers sales tax on equipment in states where it applies, and any contractor fees directly associated with installation. Roof work required to support the panels is generally not eligible. Keep all receipts and your installer’s itemized contract — the IRS can request documentation during an audit. One more detail: the credit applies to the combined cost of panels, inverter, racking, wiring, and any monitoring equipment in the installation contract, so a $26,000 all-in quote qualifies on the full $26,000, not just the panel hardware alone.

State-by-State Net Solar Prices After All Incentives

Federal credit aside, what you pay net of all programs differs dramatically by state. These figures use an 8 kW system at $26,000 gross as the baseline. After the 30% federal ITC ($7,800), the base net cost is $18,200 — but state programs push that number lower in many places.

California homeowners benefit from the Self-Generation Incentive Program (SGIP) for battery storage and strong net metering rules, though the state ended its direct solar rebate years ago. Net cost for an 8 kW system typically lands around $18,000 to $19,500 after the federal credit alone. Massachusetts adds a 15% state tax credit (capped at $1,000) plus the Solar Massachusetts Renewable Target (SMART) program, which pays a per-kWh incentive for up to 10 years — effectively reducing net cost to $16,000 to $17,500 for many households. New York offers a 25% state credit capped at $5,000, bringing net costs as low as $13,200 on a $26,000 system once both credits are stacked. To apply this credit correctly, start with a firm figure from our guide to How Much Do Solar Panels Cost in 2026? Complete US.

Texas has no state income tax and therefore no state solar tax credit, but property tax exemptions on solar-added home value and utility rebates in some service territories partially compensate. Net cost typically sits at $18,000 to $19,000. Hawaii offers a 35% state credit capped at $5,000, and with the highest electricity rates in the nation — averaging over $0.39/kWh per EIA data — payback periods can rank among the shortest in the country even at higher gross install costs.

Horizontal bar chart showing net solar system cost after federal and state tax credits for 10 US states
Net solar cost after all incentives varies by nearly $6,300 across states. New York’s combined federal and state credits reduce a $26,000 system to roughly $13,200, while Louisiana homeowners with minimal state incentives net around $19,500. Source: IRS, DSIRE, NREL 2026.

Connecticut runs the Residential Solar Investment Program through the Connecticut Green Bank, offering performance-based incentives alongside the federal credit, with net costs around $16,500 to $17,500. Colorado customers of Xcel Energy can access a $0.05/watt rebate on top of the federal credit, landing net costs near $17,000 to $18,000 for most households. Across all 50 states, the spread between the highest- and lowest-incentive markets runs roughly $5,000 to $7,000 on a standard residential system — a gap large enough to materially change your payback timeline.

Which States Offer Additional Solar Tax Credits

Beyond the federal 30%, fourteen states currently offer their own income tax credits for solar installations. The most generous programs in 2026 are New York (25%, max $5,000), Hawaii (35%, max $5,000), South Carolina (25%, no cap), and Massachusetts (15%, max $1,000). Several others — including Iowa, Montana, and Utah — offer smaller credits between 5% and 15%.

South Carolina deserves particular attention: its uncapped 25% state credit stacks directly on top of the federal 30%, meaning a homeowner can theoretically recover 55% of total system cost through tax credits alone. The catch is that the state credit must be spread across ten years if it exceeds annual tax liability in any single year. On a $26,000 system, that is $6,500 in state credits recovered over a decade, plus the $7,800 federal credit in year one — a combined $14,300 in total credit value on a single installation.

New Jersey takes a different approach entirely. Rather than a direct tax credit, it runs the Transition Renewable Energy Certificate (TREC) program, which pays solar owners for every megawatt-hour generated. At current TREC rates, a typical 8 kW system in New Jersey generates roughly $800 to $1,200 in annual certificate income over 15 years — worth $12,000 to $18,000 in total. That rivals or exceeds the value of most state tax credits available elsewhere. You can model these long-term cash flows using our solar ROI calculator to compare incentive structures side by side before committing to a financing approach.

States with no state income tax — Florida, Texas, Washington, Nevada, and Wyoming — cannot offer income tax credits by definition. However, Florida and Nevada compensate with strong net metering policies and full property tax exemptions on solar-added home value. Washington provides a sales tax exemption on solar equipment purchases, saving roughly $2,000 to $3,000 on a mid-size system. Understanding your state’s specific combination of credit, rebate, and exemption programs is essential before accepting any installer quote as your real out-of-pocket cost figure.

Utility Rebates and Net Metering Value

Utility rebates and net metering policies do not appear on your installer contract, but they directly reduce your effective solar cost over time. SEIA data shows that net metering alone can shorten effective payback periods by 1.5 to 3 years in states with full retail-rate compensation — a difference worth thousands of dollars across a system’s 25-year life.

Net metering lets you send surplus solar electricity to the grid and receive a credit on your utility bill, typically at the full retail electricity rate. States like California, New York, Massachusetts, and New Jersey maintain strong net metering rules that credit homeowners at rates between $0.18 and $0.32 per kWh depending on the utility. Others, like Arizona and Nevada, have shifted to avoided-cost compensation — paying solar exporters closer to the wholesale electricity rate, which is significantly lower than retail. This policy difference can push effective payback two to four years longer compared to a full retail-rate state.

Utility rebates vary considerably as well. Austin Energy’s residential solar rebate in Texas offers $2,500 for systems under 10 kW. Georgia Power provides $450 per kW for qualifying customers, though enrollment is capped and closes early most years. Duke Energy in the Carolinas offers performance-based incentives that pay per kWh generated for the first five years of operation. Because these programs are first-come, first-served and change annually, verify your utility’s current incentive page before signing any installer contract — a program that existed six months ago may already be closed.

Property tax exemptions add another layer of value. At least 36 states exempt solar installations from residential property tax assessments. This matters because a well-sized solar system typically adds $20,000 to $30,000 in appraised home value, per Lawrence Berkeley National Laboratory research. Without the exemption, that added value would trigger a higher annual property tax bill. Over a 25-year system life, the exemption is worth $5,000 to $15,000 depending on local millage rates — a meaningful addition to your total incentive stack that never appears on any installation quote.

How to Calculate Your Actual Net Solar Cost

Working through the math in order prevents the sticker shock that comes from comparing gross installer quotes without accounting for what you recover.

Step 1: Get quotes in dollars per watt. Divide the total installed price by system size in watts to compare offers on equal footing. A competitive quote in 2026 runs $2.80 to $3.40 per watt all-in. Any quote above $4.00 per watt warrants a second opinion from another installer.

Step 2: Apply the 30% federal ITC. Multiply gross cost by 0.70 to get your federal-net price. Verify your tax liability is large enough to absorb the full credit in year one. If not, plan your carry-forward across two or three tax years so no credit goes wasted.

Step 3: Subtract state tax credits. Find your state’s current incentive rate on the DSIRE database (dsireusa.org), maintained by NC State University and updated throughout the year. Apply the percentage to your gross cost, note any dollar caps, and account for carry-forward rules that may spread the benefit over multiple years. For more on this topic, see our guide to Solar Panels in Ohio.

Step 4: Factor in utility rebates. Contact your utility directly or check their website. Apply any upfront dollar rebates to reduce your net cost figure. Do not assume a rebate is available — many programs have waitlists or annual funding caps that exhaust early in the calendar year.

Step 5: Estimate net metering value. A properly sized solar system typically exports 20 to 30 percent of total generation as surplus. Multiply estimated annual export in kWh by your net metering rate. Discount that annual income stream over 10 years to a present-value figure and subtract it from your net cost to arrive at the true effective price.

Worked example for New York: on a $26,000 system, the federal credit is -$7,800, the state credit is -$5,000, and a modest NYSERDA incentive adds another -$400, giving a net installed cost of $13,200. Add roughly $600 per year in net metering income over 10 years and the effective 10-year cost falls below $7,500 — compared to an average New York electricity bill of $1,400 to $1,800 per year. To run the same calculation for your own address with local electricity rates and your preferred financing terms, the solar savings calculator produces a full 25-year cash flow and shows whether your system pays off positively from month one.

Find your exact solar savings

Enter your ZIP code for a personalized estimate using your state's electricity rate and sun hours.

Free · No signup · Uses EIA & NREL data

Frequently asked questions

Direct answers for US homeowners — sized for a $150/month electric bill.

The federal residential solar tax credit is 30% in 2026, as set by the Inflation Reduction Act. It applies to the full installed system cost including equipment, labor, and permitting. The 30% rate holds through 2032, then drops to 26% in 2033 and 22% in 2034. Claim it on IRS Form 5695 filed with your federal return for the year your system is placed in service.

$150/month electric bill by state

System size and payback vary by electricity rate and sun hours — see your state.

Compare all 50 states for $150/mo →

Popular state solar guides

Electricity rates and incentives vary — see data for your state.

View all 50 states →

Popular utility companies

Solar rules and net metering vary by utility — not just by state.

Methodology & data sources

Calculation method: System size uses NREL PVWatts derate factor (0.82). Costs based on SEIA 2026 installed cost ($2.75–$3.20/W). Payback uses net cost after 30% federal ITC (IRC Section 25D). Savings assume full-retail net metering unless noted.

Official sources: EIA state electricity rates · NREL PVWatts · Energy.gov ITC guide · DSIRE incentives · SEIA market data · IRS Publication 5695.

All figures are estimates for educational purposes — not tax, legal, or investment advice. Consult a licensed installer and CPA for your situation.

Calculate my savings →