Homeowners who charge an electric vehicle with rooftop solar are saving an average of $1,800 per year on combined fuel and electricity costs, according to data compiled by the National Renewable Energy Laboratory (NREL). That figure gets discussed in general terms all the time, but what it actually looks like in someone’s electricity bill β and how long it takes to feel real β is a different conversation. This article pulls together numbers from homeowners across multiple states, breaks down how the savings split between the solar system and the vehicle, and gives you a realistic picture of what to expect before you commit to either.
The math is genuinely compelling, but it is not uniform. A homeowner in California charging a Tesla Model 3 on a time-of-use rate is in a completely different financial situation from someone in Texas with a flat-rate utility contract and a Ford F-150 Lightning. Both scenarios can work well, but pretending they produce the same numbers would not be honest. The variables that matter most are your local electricity rate, how many miles you drive annually, and whether your utility offers net metering on solar exports.
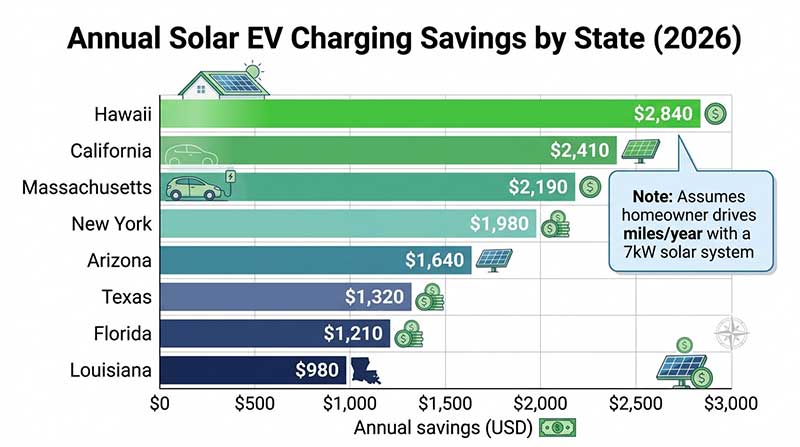
The good news is that enough real homeowners have run these systems long enough that the data is no longer theoretical. We can say with reasonable confidence what the annual solar EV charging savings ranges look like, where the weak spots are, and which states currently offer the best combination of solar incentives and EV electricity rates.
How Much Does It Cost to Charge an EV Without Solar?
Before solar enters the picture, the baseline cost to charge an electric vehicle in the US averages around $0.16 per kWh, based on EIA 2025 residential electricity price data. A typical EV consumes about 3.5 miles per kWh, which works out to roughly $0.046 per mile β compared with approximately $0.12 per mile for a gas vehicle averaging 30 mpg at $3.60 per gallon.
That gap is meaningful on its own. A driver covering 15,000 miles per year spends about $680 charging an EV versus $1,800 in gasoline. But electricity rates in the US range from $0.10 per kWh in Louisiana to over $0.30 per kWh in Hawaii, which means the annual charging cost for that same 15,000-mile driver ranges from roughly $430 to $1,285 depending entirely on where they live. If you want to model your own situation precisely, the EV charging cost calculator at GreenEnergyCalc lets you input your exact rate and annual mileage to get a personalized number.
Time-of-use (TOU) rates add another layer. Many utilities charge $0.08β$0.12 per kWh overnight β sometimes half the peak rate β which is why charging overnight even without solar cuts the annual bill considerably. The problem is that TOU pricing often spikes during the 4β9 PM window that catches a lot of commuters coming home and plugging in immediately. Solar production peaks between 10 AM and 3 PM, which creates a natural alignment problem: your panels are producing when you are at work, and you need power when the panels have stopped.
That mismatch is exactly where battery storage starts to make financial sense, though it adds cost. A homeowner in Arizona running a 10 kWh battery alongside their solar array can capture midday production and discharge it into the EV charger during the evening peak window, effectively eliminating exposure to rates that sometimes exceed $0.28 per kWh. Without the battery, the savings are still real β just smaller. Understanding your true baseline electricity cost before adding solar is the essential first step in calculating how much the combined system will return.
What Solar Actually Adds to the EV Charging Equation
Adding rooftop solar to a home that already has an EV changes the math substantially. NREL modeling suggests a 7 kW solar system in a moderately sunny location produces roughly 8,400 kWh per year. An EV driver covering 15,000 miles annually consumes about 4,300 kWh for transportation. That means a 7 kW system can theoretically cover all EV charging and still have surplus generation to offset household electricity use.
The practical savings depend on self-consumption rate β how much of that solar output you actually use directly versus exporting to the grid and receiving a net metering credit. Homeowners who charge during the day (remote workers, retirees, people with a flexible schedule) routinely achieve self-consumption rates of 60β75%. Households where everyone leaves at 7 AM and returns at 6 PM might see self-consumption drop to 35β45% without battery storage. The difference in annual savings between those two scenarios can be $400 or more. For more on this topic, see our guide to Solar Panels in Ohio. For more on this topic, see our guide to Solar Panels in Hawaii.
Real homeowner data collected by EnergySage from 2023β2024 puts concrete numbers on this range. The median combined annual saving for EV-owning solar households was $1,640 β covering both the electricity offset on the home and the fuel replacement for the vehicle. Households in the top quartile, typically located in high-rate states with higher annual mileage, reported savings of $2,400β$3,100 per year. The bottom quartile, concentrated in low-rate states with shorter commutes and limited daytime charging access, came in at $900β$1,200 annually. These are not projected figures; they reflect actual billing data from systems that had been running for at least 12 months.
The solar EV charging savings calculator on this site runs these specific variables β your rate, your mileage, your system size β so you are not working from national medians that may not reflect your situation at all.

How Adding an EV Changes Your Solar Payback Period
A solar system sized to cover household electricity use only β say, a 6 kW array for a 1,500 sq ft home β might have a payback period of 7β10 years depending on location and incentives. Add an EV to the household and the calculation shifts: the additional electricity demand justifies a larger system, typically 1.5β2.5 kW of extra capacity, but the savings from fuel replacement accelerate the financial return on that incremental investment considerably.
Here is how the math works for a homeowner in Massachusetts, where the average residential electricity rate is around $0.25 per kWh. Without an EV, a 6 kW system costs roughly $13,200 after the 30% federal Investment Tax Credit and pays back in approximately 7.1 years. With an EV added and the system expanded to 8 kW, the post-credit cost rises to about $17,600, but the payback period actually shortens to around 6.3 years β because fuel savings are now stacked on top of the electricity offset.
The effect is most pronounced in high-rate states. In Indiana, where rates average around $0.14 per kWh, the same calculation produces a payback period of 9.2 years without the EV and 8.5 years with it β still an improvement, but a more modest one. The pattern holds broadly across the country: adding an EV to a solar household shortens payback almost universally, but the magnitude depends heavily on how expensive your grid electricity is.
The federal ITC remains at 30% through 2032 under current IRA provisions, which meaningfully reduces the upfront cost for anyone purchasing a system outright. Homeowners who finance through a solar loan should factor loan interest into their net annual savings figure, as it can reduce the effective return by $150β$300 per year depending on the loan term and interest rate. The IRS requires you to claim the credit in the tax year the system is placed in service, and it is non-refundable β meaning it reduces tax owed but does not generate a refund if your liability is smaller than the credit amount, though any unused portion can carry forward to the following year.
Net Metering’s Role in Solar EV Charging Economics
Net metering is the policy that lets solar homeowners export surplus power to the grid and receive a credit β usually at or near the retail electricity rate β applied to their bill. For EV owners specifically, it functions as a kind of virtual battery: you export power at noon, drive home at 6 PM, draw grid power to charge the car, and the metering system nets it out on your monthly statement. When net metering works well, the time-of-day mismatch between solar production and EV charging is largely a non-issue.
The catch is that net metering policies vary enormously by state, and several have weakened significantly in recent years. California moved from NEM 2.0 to NEM 3.0 in 2023, cutting export credits by roughly 75% during peak hours. Homeowners who installed solar before April 2023 in California are grandfathered under the more favorable terms. New installations in the state now face economics that make battery storage far less optional than it used to be.
States with strong net metering β including Washington, New Jersey, and most of New England β still offer retail-rate credits that make daytime export financially equivalent to direct self-consumption. In those states, EV owners who cannot charge during the day lose very little by exporting solar and drawing grid power at night, because the credit nearly offsets the cost dollar for dollar.
States with no net metering or wholesale-rate compensation β a situation that applies to some utilities in the Southeast β change the calculus entirely. Exporting at $0.03β$0.04 per kWh while drawing back at $0.12 creates a spread that meaningfully erodes the value of solar for EV charging. Anyone in that situation needs to weigh battery storage as part of their overall system design, since storing midday production and using it for evening EV charging eliminates the export penalty entirely. The Solar Energy Industries Association (SEIA) maintains a regularly updated net metering policy map that is worth checking for your specific utility before finalizing any system design.
Sizing Your Solar System Correctly for Home and EV Load
One of the most common mistakes homeowners make when combining solar with an EV is sizing the system for current electricity consumption without accounting for the vehicle. An EV adds roughly 3,000β5,000 kWh of annual demand depending on mileage and driving style β equivalent to adding a large home appliance load running year-round. Getting the system size right from the start avoids having to expand later, which typically costs more per watt than the original installation.
NREL guidelines suggest adding approximately 1 kW of solar capacity for every 10,000 miles of annual EV driving in a moderate-sun location. That means a household driving 12,000 miles per year needs roughly 1.2 kW of additional capacity, while a two-EV household covering 30,000 combined miles needs 3 kW or more beyond what covers the home’s base load. In sunnier states like Florida and New Mexico, the same panel count produces more annual kWh, so the required capacity addition is modestly lower.
Roof orientation and shading matter considerably at this level of precision. A south-facing roof with no shading will produce roughly 20β25% more annual output than a west-facing roof with partial afternoon shade on the same home. That difference can represent a 1 kW sizing gap β about 1,200 kWh per year, enough to cover approximately 3,500 additional EV miles. Running a proper solar output estimate before purchasing is essential if you want the system to actually cover both loads.
System sizing also affects the economics of the federal tax credit. A larger system generates a larger credit, but the production needs to be consumed β either directly, through net metering, or via battery storage β to deliver full value. Homeowners who oversize significantly without storage or favorable net metering may find that excess production earns minimal wholesale export credits while they carry a larger loan balance. Use the solar system size calculator to model the right capacity for your combined home and EV load before accepting any installer quote.
Frequently Asked Questions
How much can I save annually by charging my EV with solar panels?
Most homeowners save between $900 and $3,100 per year combining solar with EV charging, depending on local electricity rates, annual mileage, and system size. The national median sits around $1,640 per year according to EnergySage data. High-rate states like Hawaii and Massachusetts produce the largest savings. Homeowners driving over 15,000 miles annually and charging primarily during daylight hours consistently see returns at the upper end of that range.
What size solar system do I need to charge an EV?
For every 10,000 miles of annual EV driving, you need roughly 1,000β1,200 kWh of additional solar production, requiring approximately 0.8β1.0 kW of extra panel capacity in an average-sun location. A household driving 15,000 miles per year typically needs to add 1.5β2.5 kW beyond what covers the home’s base load. A 7β9 kW total system handles most single-EV households comfortably without requiring battery storage.
Does solar EV charging work without a battery?
Yes β solar EV charging works without a battery, especially for households that can schedule charging between 10 AM and 3 PM when panels peak. Daytime chargers routinely achieve self-consumption rates above 60%. Households where no one is home during the day will export most of their solar production and depend on net metering credits to offset evening charging costs. Strong net metering makes this nearly as effective as direct use.
How does the 30% federal tax credit affect solar EV charging payback?
The 30% federal Investment Tax Credit reduces upfront solar cost by nearly one-third, which directly shortens the payback period. On an $18,000 solar installation, the credit returns $5,400 when you file taxes that year. The credit is non-refundable but carries forward to the following tax year if unused. It applies to the full installed cost β panels, inverter, and labor β and remains at 30% through 2032 under current IRA provisions.
Is solar EV charging worth it in states with low electricity rates?
It produces smaller savings but remains financially viable. A homeowner in Indiana paying $0.14 per kWh saves less annually than one in Massachusetts at $0.25 per kWh, but the system also costs the same amount to install. The payback period lengthens by roughly 1β2 years in low-rate states, typically reaching 8β10 years versus 6β7 years in high-rate states. Federal and state incentives can close much of that gap depending on what your state currently offers.
Data sources: U.S. Energy Information Administration (EIA) Residential Electricity Prices 2025; National Renewable Energy Laboratory (NREL) Solar-EV Household Modeling Report 2024; EnergySage Solar Marketplace Intelligence Report 2023β2024; Solar Energy Industries Association (SEIA) Net Metering Policy Map 2025; IRS Form 5695 and Energy Credit guidance 2025.