Q CELLS shipped roughly 20 gigawatts of solar panels globally in 2024, making it one of the ten largest module manufacturers in the world β and the brand most commonly quoted by US installers looking to split the difference between budget Chinese imports and premium European glass. If you’ve received a quote that includes Q.PEAK DUO BLK ML-G10+ or Q.PEAK DUO L-G10.3 panels and you’re wondering whether the price makes sense, this review covers the efficiency numbers, real-world performance data, warranty language, and the cases where Q CELLS earns its spot and where a competitor may serve you better.
The company has German roots β it was founded in 1999 in Bitterfeld-Wolfen and built a strong European reputation before being acquired by South Korean conglomerate Hanwha Group in 2012. Manufacturing today is split across South Korea, Malaysia, and a facility in Dalton, Georgia, which matters if you want panels that qualify for the full 30% federal Investment Tax Credit under the Inflation Reduction Act’s domestic content adder. The Dalton plant currently produces Q.PEAK DUO series panels, which is relevant for homeowners in states like Georgia or across the Southeast who want to shop American-made.
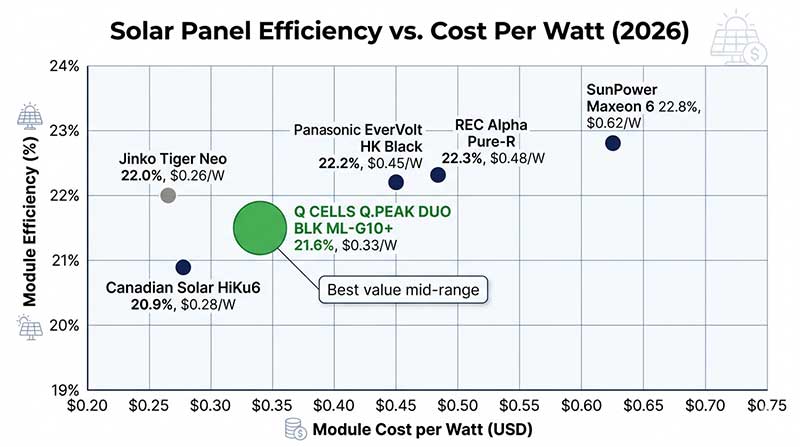
For most homeowners, Q CELLS represents a reliable tier-one option priced between $0.28 and $0.38 per watt at the module level, before installation labour. That positions the brand notably below SunPower and REC Alpha, and roughly level with Canadian Solar’s HiKu series, making it a competitive choice when you are balancing upfront cost against long-term performance guarantees.
Q CELLS Panel Specifications and Efficiency Ratings
The flagship residential line in 2026 is the Q.PEAK DUO BLK ML-G10+, a monocrystalline PERC panel available from 395W to 430W. Panel efficiency sits between 20.4% and 21.6% depending on the specific wattage bin β a respectable range for PERC technology, though it trails the 22.8% achievable with TOPCon and HJT panels from Panasonic EverVolt and REC Alpha. The Q.PEAK DUO L-G10.3 (non-black-frame version) tops out at 425W with a cell efficiency of 21.4%.
Temperature coefficient for power (Pmax) is -0.34%/Β°C on the G10+ series. In practical terms, a panel rated at 400W will produce around 387W at 45Β°C cell temperature β a typical summer afternoon value on a dark roof in Arizona. That -0.34% figure is better than the industry average of roughly -0.38%/Β°C, meaning Q CELLS panels hold their output slightly better on hot days than many competing PERC modules.
Low-light performance is an area Q CELLS actively markets, citing its proprietary Q.ANTUM cell technology, which uses a passivated rear surface and fine-line front metallisation to improve current collection under diffuse irradiation. NREL testing has broadly validated that PERC rear-passivation improves output at low angles and under cloud cover compared to standard BSF cells, though the gains are typically 2β4% relative to conventional mono cells, not the larger figures sometimes implied in marketing materials.
The 400W Q.PEAK DUO BLK ML-G10+ measures 1,755 Γ 1,038 Γ 32 mm and weighs 20.9 kg (46 lb). That’s a standard residential footprint, compatible with most rail-based racking systems without special ordering. Wind load rating is 2,400 Pa front and 2,400 Pa rear, and snow load is 5,400 Pa β adequate for most US climate zones including moderate northern snow belts. The panel carries UL 61730 and IEC 61215 certifications, both required by most US utilities and local authorities before interconnection approval.
What Q CELLS Panels Cost in 2026
Module-only pricing for Q.PEAK DUO BLK ML-G10+ panels in Q1 2026 sits at approximately $0.30β$0.36 per watt through US distributors, putting a 400W panel at roughly $120β$144 before installation. For a typical 8 kW residential system (20 panels), module cost lands between $2,400 and $2,900 β representing about 18β22% of the full installed system cost, which averages $24,000β$28,000 before incentives nationally according to SEIA data. For more on this topic, see our guide to Solar Shingles vs Solar Panels.
After the 30% federal Investment Tax Credit, that same 8 kW system falls to roughly $16,800β$19,600. Homeowners whose installers use domestically manufactured Q CELLS panels from the Dalton, Georgia facility may also qualify for an additional 10% domestic content adder under IRA rules, bringing the effective credit to 40% and reducing net cost further to around $14,400β$16,800. You can run the exact numbers for your roof size and local electricity rate using the solar tax credit calculator on this site.
Regional pricing varies meaningfully. California installers typically quote Q CELLS systems at $2.70β$3.20 per watt all-in, while Texas installers, operating in a more competitive and lower-labour-cost market, often come in at $2.40β$2.90 per watt. Massachusetts homeowners tend to pay a premium of $3.00β$3.50 per watt but benefit from the state’s SMART programme, which can add meaningful ongoing income on top of net metering.
Payback periods for a Q CELLS system typically run 7β10 years in high-electricity-cost states and 9β13 years in lower-rate markets, based on current NREL modelling. If your quoted payback feels off, use the solar payback calculator to input your actual utility rate, system size, and local sun hours for a more precise figure.

Warranty Terms: What Q CELLS Actually Guarantees
Q CELLS offers a 25-year product warranty covering manufacturing defects and a 25-year linear performance warranty on the Q.PEAK DUO series. The performance warranty guarantees no more than 2% degradation in year one and no more than 0.54% per year thereafter, with a guaranteed output of at least 86% of rated power at year 25.
That 0.54% annual degradation figure is slightly better than the industry standard of 0.55β0.60% per year that NREL cites as typical for monocrystalline PERC panels in its Long-Term PV Degradation Study. Over 25 years, this means a 400W panel should still produce a minimum of 344W β or about 860 kWh annually on a south-facing roof in a mid-sun location.
An important distinction in Q CELLS warranty language: the product warranty is honoured by Hanwha Q CELLS USA Inc., a US legal entity, which reduces the insolvency risk that makes some manufacturer warranties essentially unenforceable. The company explicitly directs warranty claims to their US operations and maintains a dedicated US claims portal. This matters more than many buyers realise β several competing panel brands nominally offer 25-year warranties backed by entities that either don’t exist in the US or hold no US assets to pursue.
The warranty does not cover damage from improper installation, physical impact, or use of incompatible mounting hardware. Ensure your installer uses approved rail and clamp systems and documents the installation to IEC 61215 and IEC 61730 standard requirements, which most US utilities require for interconnection approval anyway.
For those adding battery storage alongside a Q CELLS system, note that the panel warranty is independent of inverter and battery warranties β a battery storage sizing calculation will help you determine the right backup capacity without over-investing in a system the panels may ultimately outlast.
How Q CELLS Compares to SunPower, Canadian Solar, and Panasonic
Understanding where Q CELLS sits relative to key competitors clarifies whether the mid-range price is genuinely justified for your situation. At the premium end, SunPower Maxeon 6 panels deliver 22.8% efficiency with a 40-year performance warranty, but module pricing of $0.55β$0.70 per watt makes a typical 8 kW system cost $4,400β$5,600 more at the panel level alone before installation labour.
Canadian Solar’s HiKu6 series is the most direct competitor, priced at $0.26β$0.30 per watt with efficiency up to 20.9% β slightly below Q CELLS on both metrics. For budget-conscious buyers in states with modest electricity rates, Canadian Solar can reduce total module cost by $400β$800 on an average residential system. Q CELLS’ advantage is the combination of slightly higher efficiency, the domestic Dalton manufacturing option, and stronger US warranty infrastructure.
Panasonic EverVolt HK Black panels achieve 22.2% efficiency at $0.42β$0.48 per watt and carry an industry-leading temperature coefficient of -0.26%/Β°C, making them the better choice for rooftops in hot climates such as Nevada or Florida where heat-related losses accumulate significantly over a system’s life. However, Panasonic’s narrower US installer network means competitive installation quotes are harder to obtain outside major metro areas.
Jinko Solar’s Tiger Neo series offers strong efficiency at the lowest price point β around $0.24β$0.28 per watt β but lacks US-based warranty support and domestic manufacturing, which can complicate ITC domestic content claims and long-term recourse. EIA data shows the average residential solar system in the US produces for 25β30 years, making warranty structure a material financial consideration rather than mere marketing language. For homeowners prioritising total installed cost above all else, Jinko is a reasonable choice; for those who put weight on warranty bankability and made-in-USA credentials, Q CELLS holds a clear advantage.
Q CELLS Performance in Real-World Conditions
Independent performance monitoring data from projects on the PVOutput community database and EnergySage’s installer network provides useful real-world validation. Systems using Q.PEAK DUO panels in North Carolina and across the Sun Belt generally perform within 3β5% of their modelled PVWatts output β consistent with well-manufactured tier-one panels operating as specified.
One area that receives less marketing attention is potential-induced degradation (PID) resistance. Q CELLS rates its Q.PEAK DUO series as PID-resistant per IEC 62804 testing, which is increasingly important as string inverter system voltages exceed 1,000V in larger residential and commercial installations. Panels without PID resistance can lose 5β30% output over time when installed in high-voltage strings, particularly in humid climates.
Soiling and dust accumulation affect Q CELLS panels similarly to any glass-fronted module. The front glass uses an anti-reflective coating that helps maintain output under light soiling, but Q CELLS does not claim a self-cleaning surface. In dry, dusty regions, homeowners should plan for at least one manual rinse per year to maintain modelled output targets.
Field failure rate data from EnergySage’s 2024 installer survey places Q CELLS in the lower-failure-rate tier among leading brands, with reported defect rates under 0.1% over 5-year installation windows. This aligns with Q CELLS’ Bloomberg NEF Tier 1 classification, held continuously since 2013. Tier 1 status measures bankability and manufacturing quality control, not raw panel performance, but it correlates with consistent module quality over time. For buyers who want to model exactly how many kilowatt-hours their specific roof and panel combination will generate before committing, the solar output calculator lets you input azimuth, tilt, shading, and local irradiance to project annual production figures.
Frequently Asked Questions
Are Q CELLS panels made in the USA?
Some Q CELLS panels are manufactured at the company’s Dalton, Georgia facility, expanded in 2023 to roughly 3.3 GW of annual capacity. Panels built there may qualify for the 10% domestic content adder under the Inflation Reduction Act, lifting the federal tax credit to 40%. Ask your installer to confirm whether the specific panels quoted originate from Dalton or from Q CELLS facilities in South Korea or Malaysia.
How does Q CELLS compare to Canadian Solar for residential use?
Both are tier-one manufacturers priced between $0.28 and $0.38 per watt at the module level. Q CELLS Q.PEAK DUO panels offer slightly higher efficiency (21.6% vs. 20.9% for Canadian Solar HiKu6) and a marginally better temperature coefficient (-0.34% vs. -0.35%/Β°C). Canadian Solar covers the lower price end more broadly. For most homeowners, the decision comes down to which brand your installer supports with their own workmanship warranty.
What is the lifespan of a Q CELLS solar panel?
Q CELLS guarantees at least 86% of rated output at year 25 under its linear performance warranty, with annual degradation capped at 0.54% after year one. Based on NREL degradation studies, many well-manufactured monocrystalline panels continue producing usable power beyond 30 years. Panels commonly outlast inverters β most string inverters carry 10β12 year warranties and typically require one replacement over a 25-year panel lifespan.
Is Q CELLS a reliable brand for a 25-year investment?
Q CELLS has held Bloomberg NEF Tier 1 manufacturer status since 2013, indicating strong manufacturing quality and financial bankability. Parent company Hanwha Group reported revenues exceeding $60 billion in 2023, substantially reducing the risk that the warranty backer becomes insolvent. No manufacturer can guarantee a 25-year outcome with certainty, but Q CELLS carries lower counterparty risk than most competing brands in its price tier.
What inverter works best with Q CELLS panels?
Q CELLS Q.PEAK DUO panels are standard monocrystalline PERC modules compatible with any UL-listed string inverter, microinverter, or power optimiser. The maximum system voltage is 1,500V DC, covering both residential and commercial configurations. Enphase, SolarEdge, SMA, and Fronius all pair cleanly with Q.PEAK DUO panels. Q CELLS also markets its own Q.HOME+ hybrid inverter, though independent installer feedback consistently rates the panels more highly than the storage product.
Data sources: SEIA U.S. Solar Market Insight 2025; NREL PVWatts Calculator and Long-Term PV Degradation Rate Study; EIA Residential Energy Prices 2025; IRS Notice 2023-29 (domestic content ITC adder); Hanwha Q CELLS product datasheets and warranty documents Q1 2026; Bloomberg NEF Tier 1 module classification list 2026; EnergySage Solar Marketplace Report 2024.