The most efficient residential solar panels available in 2026 convert up to 24.1% of sunlight into electricity — a figure that would have seemed extraordinary just a decade ago. But efficiency ratings on a spec sheet don’t always translate directly into the best financial return for your home. The decision between a premium high-efficiency panel and a mid-range option depends heavily on your roof size, local electricity rates, and how long you plan to stay in your home.
Panel efficiency has climbed steadily over the past five years, driven by advances in monocrystalline PERC and TOPCon cell technology, and more recently by the commercial rollout of heterojunction (HJT) and back-contact designs. According to NREL, the average efficiency of residential panels shipped in the US reached 22.3% in 2025, up from 19.8% in 2021. That jump matters most when roof space is limited — if you can fit only 20 panels, squeezing out an extra 1.5% efficiency could add meaningful kilowatt-hours over a 25-year lifespan.
That said, premium panels carry a real price premium. Understanding exactly how much more you’ll pay — and what you’ll get in return — is the core question this guide addresses.
How Solar Panel Efficiency Is Measured (and What It Actually Means)
Efficiency is the percentage of sunlight hitting a panel that gets converted into usable electricity under Standard Test Conditions (STC): 25°C cell temperature, 1,000 W/m² irradiance, and air mass 1.5. Real-world output is always lower because panels heat up, clouds diffuse light, and installation angles are rarely perfect. Understanding these conditions is the first step in comparing high-efficiency solar panels honestly against spec-sheet marketing.
A panel rated at 23% efficiency produces 230 watts per square metre of panel surface. A standard 20% panel produces 200W per square metre — a difference of 30W per panel, or roughly 750 kWh per year for a 10kW system under average US sunlight conditions. At the national average electricity price of $0.17 per kWh reported by the EIA in early 2026, that gap is worth about $127 per year in avoided grid costs.
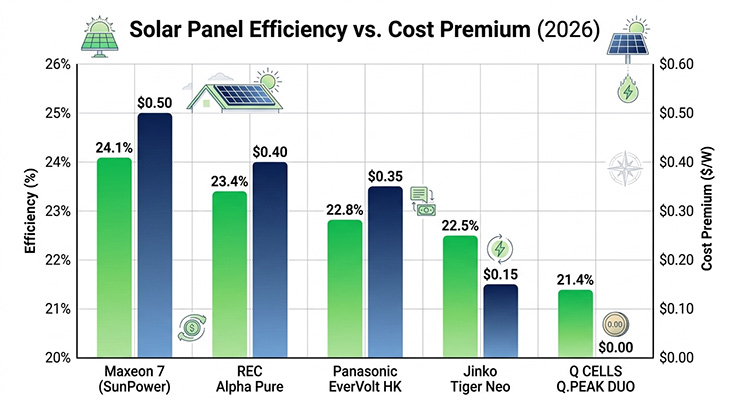
The gap between brands also matters. As of mid-2026, the leading panels by efficiency include the Maxeon 7 (SunPower) at 24.1%; the REC Alpha Pure at 23.4%; the Panasonic EverVolt HK Black Series at 22.8%; the Jinko Tiger Neo at 22.5%; and the Q CELLS Q.PEAK DUO BLK ML-G10+ at 21.4%. The Jinko and Q CELLS panels are particularly relevant because they offer efficiency ratings within striking distance of the premium tier at prices roughly 20–30% lower per watt — a trade-off that often makes more financial sense for homeowners with adequate roof space.
Temperature coefficient is another figure worth scrutinising. This tells you how much a panel’s output drops for every degree Celsius above 25°C. Heterojunction panels like the Panasonic EverVolt carry a coefficient of around -0.26%/°C — meaningfully better than standard PERC panels at -0.35%/°C. In hot climates like Arizona or Texas, that advantage accumulates across summer months when electricity demand — and its cost — peaks most sharply. Power tolerance also matters: a panel with a +5W/-0W tolerance guarantees output at or above its rated wattage, while some budget options allow negative tolerance that effectively ships fewer watts than advertised.
The Real Cost of High-Efficiency Solar Panels in 2026
Premium panels cost more per watt to manufacture, and that cost flows directly through to your installer quote. In 2026, expect to pay roughly $0.30–$0.50 per watt more for a top-tier panel compared to a mid-range option — translating to $1,500–$2,500 extra on a typical 8–10kW residential system before incentives.
Whether that premium is worthwhile depends on three variables: how much more electricity the premium panel generates over its lifetime, the value of that electricity at your local rate, and how much you’d pay to finance the difference. None of those figures is fixed, which is why blanket advice about premium panels being “worth it” rarely holds across different households. Before you can answer the question for your own home, you need a firm handle on your baseline system size. A solar system size calculator can help you determine exactly how many panels you need and what output to expect — which sets the foundation for any meaningful efficiency comparison. For more on this topic, see our guide to Solar Panels in Wisconsin.
The 30% federal Investment Tax Credit (ITC) applies to the full installed cost under current IRS rules, meaning a $2,000 panel-tier premium effectively costs $1,400 after the credit. Some states add further incentives: New York offers a 25% state tax credit capped at $5,000, and several other states stack rebates that reduce the absolute cost gap between panel tiers. The federal solar tax credit calculator can show you exactly how the ITC reduces your total system cost based on your filing status. For a full price breakdown by system size and region, see our guide to How Much Do Solar Panels Cost in 2026? Complete US.
The payback period shifts significantly with your local electricity rate. Homeowners in Hawaii, where residential electricity averages $0.43 per kWh according to EIA 2026 data, recoup efficiency premiums far faster than homeowners in Louisiana, where rates average $0.11 per kWh. A $1,400 post-ITC premium might pay back in six years in Hawaii but take 20 years in Louisiana — at which point you are approaching the end of the panel’s performance warranty anyway.
Roof Space Constraints: When Paying for Higher Efficiency Makes Sense
The strongest argument for premium high-efficiency panels is a constrained roof. If obstructions, shade from neighbouring structures, or an awkward orientation limits you to fewer than 15–18 panels, choosing the highest-efficiency option available may be the only practical way to meet your full energy needs from solar alone.
A south-facing roof with room for 30 panels is a completely different situation. There, you can install a larger array of moderately efficient panels and match or exceed the total output of a smaller premium array — often at a lower total system cost per kilowatt-hour generated. The economics favour mid-range panels whenever roof space is not the binding constraint.
Consider a worked example. A homeowner in Massachusetts uses 9,000 kWh per year. With 20 panels at 410W each, they’d generate around 8,200 kWh annually. Upgrading to premium 450W panels increases that to about 9,000 kWh — covering the full annual bill. But if that homeowner has room for 22 panels, the mid-range option already covers the full load at a lower cost per watt. The efficiency upgrade earns its premium only when space genuinely forces the issue.
Shading complicates things further. Efficiency ratings assume full, unobstructed sunlight. A 24% panel with 20% of its surface shaded for three hours a day will underperform a 21% panel on a clean, unshaded roof. Where partial shading exists, micro-inverters or DC power optimisers will improve annual output more than an efficiency upgrade will — and that’s a separate line item your quote should address.
Warranty terms also differ between tiers. Premium panels from Maxeon and Panasonic carry a 25-year product and performance warranty with a guaranteed output floor of 90% at year 25. Many mid-range panels warrant only 80% output over the same period. That 10-percentage-point difference is real money — on a 10kW system producing 14,000 kWh annually, it represents roughly 1,400 kWh of additional guaranteed output per year by the end of the warranty term, worth around $238 at current average electricity rates.
Long-Term Degradation Rates: The Hidden Factor in Solar Panel Value
Efficiency at installation is only part of the story. Panels degrade over time, and the rate varies meaningfully between technologies. NREL’s long-term field data shows that premium monocrystalline and heterojunction panels typically degrade at 0.3–0.4% per year, while lower-tier polycrystalline panels degrade at 0.5–0.7% per year. That difference is invisible in year one but compounds into a significant output gap by year 15.
Over a 25-year lifespan, a panel degrading at 0.35% per year retains about 91.5% of its original output. A panel degrading at 0.6% per year retains only 86%. On a 10kW system originally producing 14,000 kWh annually, that 5.5-percentage-point gap equals roughly 770 kWh per year by year 25 — worth about $131 annually at the current EIA national average rate.
SEIA’s 2025 market report found that the average US residential solar system stayed in service for 26.4 years before a significant component replacement. Most homeowners will therefore experience the full arc of this degradation curve. A panel’s quality tier affects your total 25-year energy yield, not just your first-year output — and that shifts the payback calculation when you model it with realistic degradation inputs.
Long-term degradation data also carries implications for resale value. An independent inspection will typically note the panel brand, age, and warranty status. Premium panels with intact 25-year warranties and documented low-degradation track records are straightforwardly easier to value and transfer in a property sale — a real consideration if you might sell before the system fully pays back.
Independent testing from Kiwa PV Evolution Labs (formerly PVEL) adds another layer of useful data. Their annual PV Module Scorecard subjects panels to accelerated stress testing — thermal cycling, damp heat, UV exposure — and results don’t always mirror nameplate efficiency rankings. Several mid-range panels from established manufacturers consistently outscore premium-priced competitors on durability, which is a useful corrective to efficiency-only comparisons.
Which High-Efficiency Solar Panel Is Right for Your Home in 2026
Choosing between premium and mid-range panels comes down to four practical factors: roof space, local electricity rate, available incentives, and how long you intend to own the home. Here is how the leading 2026 options stack up across the most common homeowner situations.
For maximum power density on a limited roof, the Maxeon 7 at 24.1% is the clearest choice. No commercially available residential panel in 2026 matches it for output per square metre, and its 40-year extended warranty option is unmatched in the industry. The per-watt cost is the highest in the market, but when roof space is genuinely the binding constraint, a lower-efficiency panel simply cannot deliver the same output regardless of how it is financed.
For the best overall value at high efficiency, the Jinko Tiger Neo at 22.5% is where the value curve bends most favourably. Its price premium over mid-range options sits at roughly $0.15 per watt — far below the Maxeon 7’s $0.50 premium — while the efficiency gain over standard panels remains meaningful across a 25-year horizon. For most homeowners seeking better-than-average long-term performance without paying for the absolute top of the market, this is the right panel to specify.
For hot-climate installations, the Panasonic EverVolt HK Black Series stands out on the strength of its -0.26%/°C temperature coefficient. In Florida, where summer heat regularly pushes panel surfaces above 55°C, real-world annual output from heterojunction panels typically exceeds what the nameplate efficiency alone would predict. For homeowners with ample roof space and a tighter installation budget, the Q CELLS Q.PEAK DUO BLK ML-G10+ at 21.4% delivers reliable long-term performance at the lowest cost per watt among quality-tier options, with Kiwa PV Evolution Labs consistently rating it among their top durability performers.
The most important step before committing to any panel tier is modelling the actual returns for your home. Use the solar savings calculator to compare how different panel efficiencies and system sizes affect your 25-year savings under your local electricity rate — it is the fastest way to move past spec-sheet comparisons and get a clear answer for your specific situation.
Frequently Asked Questions
What is the most efficient residential solar panel available in 2026?
The Maxeon 7 by SunPower holds the top spot at 24.1% efficiency as of mid-2026, making it the highest-rated commercially available residential panel. REC Alpha Pure follows at 23.4%. Both use back-contact or heterojunction cell technology. Premium efficiency panels cost roughly $0.30–$0.50 per watt more than mid-range options before the 30% federal tax credit is applied.
Are high-efficiency solar panels worth the extra cost?
It depends on your roof size and local electricity rate. If you have limited roof space — fewer than 18 panels — premium efficiency is often essential because it is the only practical way to generate enough power from the available area. If you have ample space, adding more standard panels typically costs less than upgrading to premium and delivers equivalent total annual output. Always model your specific numbers before deciding.
How much do the most efficient solar panels cost in 2026?
Top-tier panels like the Maxeon 7 cost around $0.90–$1.10 per watt at the component level. Installed system prices for premium setups typically run $3.50–$4.20 per watt before incentives, versus $2.80–$3.20 per watt for mid-range systems. The 30% federal ITC reduces both figures proportionally, bringing a $4.00 per watt premium system to an effective $2.80 per watt after the credit is applied.
How long do high-efficiency solar panels last?
Premium monocrystalline and heterojunction panels carry 25-year warranties and degrade at 0.3–0.4% per year, retaining roughly 91% of original output at year 25 according to NREL field data. Mid-range panels degrade at 0.5–0.7% per year, retaining around 86% at year 25. That 5-percentage-point gap in guaranteed long-term output affects both total energy savings and property resale value.
Do high-efficiency panels perform better in shade or cloudy weather?
Not inherently — efficiency ratings measure performance in full sunlight under Standard Test Conditions. In shaded situations, your inverter type and whether DC optimisers are installed matters far more than the panel’s nameplate efficiency. Heterojunction panels do perform relatively better in diffuse light, but the advantage is modest — typically 2–4% more output on overcast days compared with standard PERC panels.
Data sources: U.S. Energy Information Administration (EIA) Residential Electricity Prices 2026; National Renewable Energy Laboratory (NREL) Best Research-Cell Efficiency Chart and Long-Term Degradation Study 2025; Solar Energy Industries Association (SEIA) U.S. Solar Market Insight 2025; IRS Notice 2023-29 (Investment Tax Credit guidance); Kiwa PV Evolution Labs PV Module Scorecard 2025.