US residential solar · 2026 data

How Much Do Solar Panels Save Per Year?

SAVE

$0+

Over 25 Years

$14,700 Cost after ITC
9.5 yrs Payback
7.0 kW Typical system

Most homeowners need:

  • 18–22 panels typical
  • 7.0 kW average system
  • $14,700 after tax credits
  • 9.5 year payback
✓ Updated monthly ✓ NREL data ✓ Reviewed by solar experts ✓ IRS tax credit included
· 9 min read ·By ·Reviewed by Green Energy Calculators Editorial Team

Without solar vs with solar

25-year cost comparison for a $300/month US electric bill.

Without solar

25-year utility cost

$62,000

Rates rise ~3% per year (EIA avg.)

With solar

Net system cost

$14,700

After 30% federal ITC

Your savings

Difference

+$47,300

Estimated lifetime advantage

500,000+
calculations completed
25,000+
users monthly

Trusted by US homeowners · Data sourced from

NREL EIA Energy.gov DSIRE IRS / SEIA
Author Mark Sullivan
Reviewed by Green Energy Calculators Editorial Team
Last updated
Sizing formula kW = Annual kWh ÷ (Peak Sun Hours × 365 × 0.82)

The average US homeowner saves between $1,400 and $2,000 per year after going solar, according to NREL data — but that figure swings dramatically depending on where you live, how much electricity you use, and the size of the system you install. In sunny states like Arizona and Florida, savings routinely exceed $1,800 annually. In low-rate Midwestern states, the number can dip below $900. Getting a grip on your own realistic savings starts with understanding what actually drives the math.

Three variables do most of the work: your local electricity rate, the amount of sunlight your roof receives each year, and the size of your solar array. The US average retail electricity price hit 16.4 cents per kilowatt-hour in 2025 according to the EIA, but that number ranges from under 10 cents in states like Louisiana to over 30 cents in Hawaii. A dollar saved on electricity is worth twice as much in Boston as it is in Baton Rouge — and that difference compounds over a 25-year system lifespan.

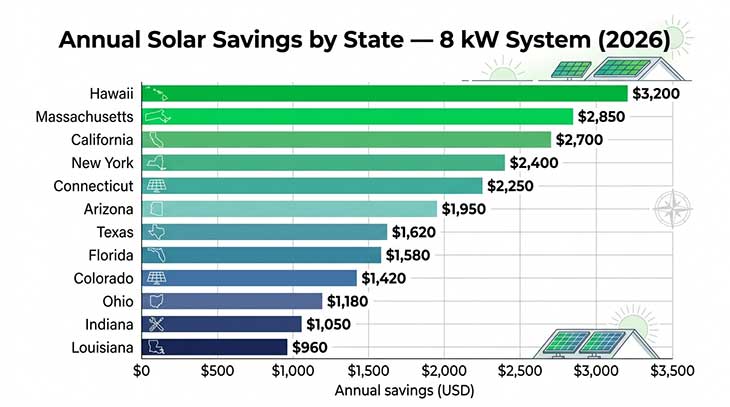
This guide breaks down solar savings by system size, compares the top and bottom states, explains which incentives add thousands more to the picture, and answers the most common questions homeowners ask before making a decision. All figures use 2025–2026 electricity rates and current federal tax credit rules.

What Drives Your Annual Solar Savings

Annual solar panel savings are essentially the electricity you produce multiplied by the price you no longer pay your utility. A typical 8 kW residential system in the US generates around 9,600 to 11,200 kWh per year depending on location. At the national average electricity rate of 16.4 cents per kWh, that translates to roughly $1,575 to $1,837 in avoided electricity costs every year.

The rate you pay matters far more than most homeowners realise. Consider two families with identical 8 kW systems. The family in California, paying around 28 cents per kWh, saves approximately $2,700 a year. The family in Oklahoma, paying closer to 11 cents, saves around $1,050. Same panels, same sunlight hours — a $1,650 annual difference purely from the electricity rate.

System size has a near-linear effect on savings — roughly $175 to $230 in additional annual savings for every extra kilowatt of capacity, depending on your state. Homeowners who size their system to cover 90–100% of their electricity use will see the best return, which is exactly what the solar savings calculator on this site models when you enter your utility bill and ZIP code.

Net metering is the other major variable. If your utility credits you at the full retail rate for excess power you send back to the grid, your savings closely match production. If they credit you at a lower “avoided cost” rate (typically 4–8 cents per kWh), you’ll want to size your system to match rather than exceed your consumption. Seventeen states currently have reduced-rate net metering policies, which is reshaping how installers recommend system sizes in those markets. Understanding your utility’s specific export rate before you sign a contract can shift the payback calculation by two to three years.

Solar vs utility company · 25-year comparison

Total cost of staying on the grid vs owning solar for a $300/month bill (national average assumptions).

Total utility payments

$62,000

Total solar cost (after ITC)

$14,700

Net savings

+$47,300

Avg. monthly difference

+$110/mo

See my savings →

Average Solar Savings by State in 2026

State-level savings vary by a factor of three across the US. The estimates below reflect annual savings for a standard 8 kW system in twelve representative states, using 2025 average electricity rates and local peak sun hours from NREL data.

Horizontal bar chart comparing annual solar panel savings in dollars for 12 US states in 2026
Annual solar savings vary by more than $2,200 across US states. Hawaii leads at $3,200/year for an 8 kW system; Louisiana sits at the low end near $960/year — a gap driven almost entirely by local electricity rates. Source: EIA, NREL 2026.

At the top of the table, Hawaii homeowners typically save $3,000–$3,400 per year on an 8 kW system — a product of electricity rates above 40 cents per kWh combined with strong year-round sun. Massachusetts is close behind at around $2,700–$2,900, driven by rates over 25 cents and a generous state net metering policy that credits excess generation at the full retail rate. For a full cost breakdown by state and system size, see our guide to How Much Do Solar Panels Cost in 2026? Complete US. For more on this topic, see our guide to How Much Do Solar Panels Save Per Month?.

In the middle of the pack, states like Texas and Florida deliver solid savings of $1,500–$1,800 annually. Electricity rates are moderate but sun exposure is excellent, with both states averaging 5.0–5.5 peak sun hours per day. The picture is different in Indiana, where lower electricity rates (around 13 cents) pull annual savings down to $950–$1,100 even though the hardware cost is similar.

One note on these estimates: they assume full retail-rate net metering. If your utility has switched to a lower export rate, adjust your savings estimate downward by 15–25% for any excess generation you can’t consume directly. This is why battery storage is increasingly part of the solar calculation — especially in states like California and Nevada that have already moved away from one-to-one net metering credits.

How System Size Affects Your Yearly Solar Savings

Most residential solar installations in the US fall between 6 kW and 12 kW. The right size for your home depends on your annual electricity consumption, your roof’s orientation and shading, and whether you plan to add an EV or heat pump in the next few years.

Here is how annual savings scale with system size at the US average electricity rate of 16.4 cents per kWh. A 5 kW system produces roughly 6,000–7,000 kWh per year and saves approximately $985–$1,148 annually. A 7 kW system steps that up to $1,380–$1,607. A 10 kW system — common for homes with higher consumption or EV charging needs — generates 12,000–14,000 kWh and saves $1,968–$2,296 per year. Every extra kilowatt of capacity adds roughly $180–$200 in annual savings in an average-rate state.

The key principle is matching the system to your actual consumption. Going bigger than your usage doesn’t help much if your utility pays below-retail rates for excess power. Going too small leaves money on the table every month. If you are adding an electric vehicle, a heat pump, or a whole-home battery, it is worth sizing up now rather than adding panels later — the cost per watt is lower when you install more capacity upfront.

For homes in New York, where rates average around 22 cents per kWh, a 10 kW system saves closer to $2,640–$3,080 per year. The difference between a 6 kW and a 10 kW installation in New York is roughly $880 in additional annual savings — enough to close the cost gap on the larger system within three to four years. NREL’s PVWatts tool confirms that oversizing by 10–15% relative to current consumption is often the right move when an EV purchase is on the horizon, since home charging typically adds 3,000–4,500 kWh of annual electricity demand. The solar system size calculator factors in your location, roof angle, and current bill to recommend the most cost-effective system capacity for your specific situation.

Federal and State Incentives That Boost Your Return

The savings figures above cover only avoided electricity costs — they don’t yet account for incentives, which can be equally significant. The federal Investment Tax Credit (ITC) currently stands at 30% through 2032 under the Inflation Reduction Act. On a $28,000 system, that’s an $8,400 reduction in your federal tax bill in year one. Spread over 25 years, that ITC is equivalent to an extra $336 per year stacked on top of your electricity savings.

State-level incentives layer on top of the federal credit. Net metering rules, property tax exemptions, and state income tax credits exist in more than 40 states. Connecticut offers a performance-based incentive that pays homeowners per kWh generated for the first six years. Some utilities offer rebates of $200–$500 per kW, which can add $1,600–$4,000 to total savings on a typical system. According to DSIRE, the national database of state energy incentives, over 1,800 active solar incentive programs existed across the US as of early 2026.

Homeowners adding battery storage can claim the same 30% ITC on the battery if it is charged exclusively by solar. This has made battery pairing much more common since 2023. According to SEIA, over 14% of new residential solar installations in 2025 included storage — up from 8% in 2022.

One frequently overlooked financial benefit: homes with solar sell for a premium. Lawrence Berkeley National Laboratory research found that US home buyers paid roughly $15,000 more for the average solar-equipped home — a one-time capital gain that doesn’t appear in annual savings figures but is very real when you sell. Combined with the ITC, state programs, and lifetime electricity savings, the total financial return on a well-sized solar installation in a high-rate state can reach $80,000–$100,000 over 25 years.

Calculating Your Real Solar Savings Before You Buy

Published averages give you a ballpark, but your actual solar savings depend on four inputs that vary by household: your current annual electricity consumption in kWh, your utility’s retail rate and net metering policy, the number of peak sun hours at your specific address, and the installed cost of the system after incentives.

The simplest starting point is your last 12 months of electricity bills. Add up the total kWh consumed — not just the dollar amounts, since rates can change. That consumption figure tells you how large a system you need and sets the ceiling for your annual savings. A household using 12,000 kWh per year at 20 cents per kWh is spending $2,400 on electricity and can theoretically eliminate most of that with a properly sized system.

Shading and roof orientation trim that ceiling meaningfully. A south-facing roof at a 30-degree tilt in Phoenix generates roughly 30–35% more electricity per kilowatt of panels than a north-facing roof in Seattle. NREL’s data shows that even modest shading from trees or a chimney can reduce annual output by 10–20%, which directly reduces savings by the same percentage.

Installation cost — typically $2.50 to $3.50 per watt before incentives in 2026, or $20,000–$28,000 for an 8 kW system — sets the payback timeline. After the 30% ITC, the effective cost drops to $14,000–$19,600. Divide that net cost by your projected annual savings to get your payback period in years. The national average works out to 8–10 years, after which every year of system output is pure financial return. For a complete, personalised picture that accounts for your address, bill, and local installer pricing, the solar payback calculator runs this calculation in under a minute.

Frequently asked questions

Direct answers for US homeowners — sized for a $130/month electric bill.

Most US homeowners save $115 to $170 per month on electricity bills after installing solar, based on a typical 8 kW system and the national average rate of 16.4 cents per kWh. Monthly savings vary significantly by state — homeowners in Hawaii and Massachusetts save $240–$290 per month, while those in low-rate states like Louisiana or Oklahoma typically see $75–$95 per month in bill reductions.

$130/month electric bill by state

System size and payback vary by electricity rate and sun hours — see your state.

Compare all 50 states for $130/mo →

Popular state solar guides

Electricity rates and incentives vary — see data for your state.

View all 50 states →

Popular utility companies

Solar rules and net metering vary by utility — not just by state.

Methodology & data sources

Calculation method: System size uses NREL PVWatts derate factor (0.82). Costs based on SEIA 2026 installed cost ($2.75–$3.20/W). Payback uses net cost after 30% federal ITC (IRC Section 25D). Savings assume full-retail net metering unless noted.

Official sources: EIA state electricity rates · NREL PVWatts · Energy.gov ITC guide · DSIRE incentives · SEIA market data · IRS Publication 5695.

All figures are estimates for educational purposes — not tax, legal, or investment advice. Consult a licensed installer and CPA for your situation.

Calculate my savings →