US residential solar · 2026 data

How Much Do Solar Panels Save Per Month?

SAVE

$0+

Over 25 Years

$14,700 Cost after ITC
9.5 yrs Payback
7.0 kW Typical system

Most homeowners need:

  • 18–22 panels typical
  • 7.0 kW average system
  • $14,700 after tax credits
  • 9.5 year payback
✓ Updated monthly ✓ NREL data ✓ Reviewed by solar experts ✓ IRS tax credit included
· 10 min read ·By ·Reviewed by Green Energy Calculators Editorial Team

Without solar vs with solar

25-year cost comparison for a $300/month US electric bill.

Without solar

25-year utility cost

$62,000

Rates rise ~3% per year (EIA avg.)

With solar

Net system cost

$14,700

After 30% federal ITC

Your savings

Difference

+$47,300

Estimated lifetime advantage

500,000+
calculations completed
25,000+
users monthly

Trusted by US homeowners · Data sourced from

NREL EIA Energy.gov DSIRE IRS / SEIA
Author Mark Sullivan
Reviewed by Green Energy Calculators Editorial Team
Last updated
Sizing formula kW = Annual kWh ÷ (Peak Sun Hours × 365 × 0.82)

The average American homeowner with solar panels saves between $100 and $150 per month on electricity — but that range masks wide variation. According to the U.S. Energy Information Administration (EIA), the national average residential electricity rate hit 16.2 cents per kilowatt-hour in 2024, meaning a 7 kW system producing 850 kWh a month wipes out roughly $138 from a typical bill. Your actual savings depend on four factors: how much electricity your home uses, how large your system is, your local utility rate, and whether your state has strong net metering rules.

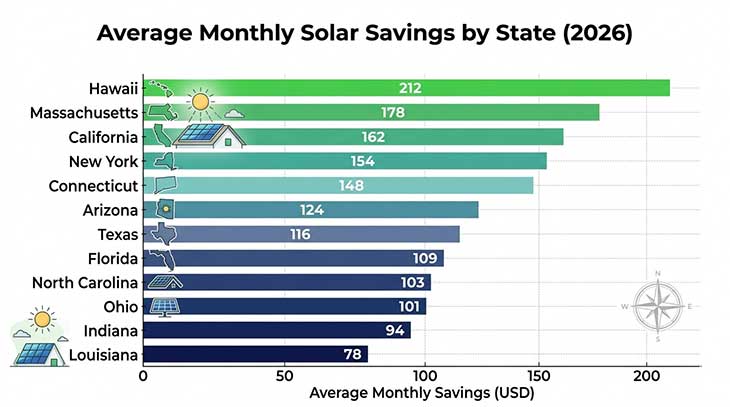
Those factors compound quickly. A homeowner in Hawaii paying 39 cents per kWh will save more than three times as much per kilowatt-hour generated as someone in Louisiana paying 12 cents. Over a 25-year panel lifespan, that gap can mean the difference between $40,000 in lifetime savings and $120,000. This article breaks down the real monthly numbers, explains what drives them, and shows you exactly what to expect based on where you live.

What the Average Monthly Solar Saving Actually Looks Like

Most homeowners go solar to cut their electric bill, but the monthly saving is not a single number — it is a range anchored to your system output and local electricity rate. NREL (National Renewable Energy Laboratory) data shows a 6 kW residential system in a mid-sun state like Arizona produces around 900 kWh per month. At Arizona’s average residential rate of 13.8 cents per kWh, that comes to roughly $124 in monthly bill offset.

Scale the system up to 8 kW — appropriate for a household using 1,200 kWh per month — and output climbs to about 1,200 kWh in the same location, pushing monthly savings close to $166 before any net metering credits for surplus power exported to the grid. In sun-rich states, a well-sized system can eliminate the electricity bill entirely, leaving only the small fixed grid connection fee that most utilities charge, typically $5 to $15 per month.

In lower-sun states the picture is more modest. An 8 kW system in Ohio averages around 750 kWh per month — about 37% less output than the same system in Arizona. At Ohio’s average rate of 13.4 cents per kWh, that translates to roughly $101 in monthly savings. Still meaningful, but it compresses the payback window compared to higher-rate states.

The single biggest lever you control before installation is system size. If you use 1,000 kWh per month and install a system sized to cover only 60% of that load, your monthly saving will plateau around $90 regardless of your local rate. Homeowners who undersize to reduce upfront cost often find their bills stay stubbornly high during peak summer months when AC usage spikes. Using a solar savings calculator before signing any contract lets you model different system sizes against your actual usage and local rate, so you can see the real bill offset — not the installer’s best-case estimate.

Horizontal bar chart showing average monthly solar savings in dollars for 12 US states
Monthly solar savings vary sharply by state electricity rate. Hawaii homeowners save an average of $212/month while Louisiana homeowners average just $78/month — a gap driven almost entirely by utility rate differences. Source: EIA, NREL 2026.

Solar vs utility company · 25-year comparison

Total cost of staying on the grid vs owning solar for a $300/month bill (national average assumptions).

Total utility payments

$62,000

Total solar cost (after ITC)

$14,700

Net savings

+$47,300

Avg. monthly difference

+$110/mo

See my savings →

How System Size and Home Energy Use Determine Your Savings

Before a single panel is installed, your monthly electricity consumption sets the ceiling on savings. The EIA reports the average US home consumed 899 kWh per month in 2023. To fully offset that usage, most installers size systems between 6 kW and 8 kW depending on local peak sun hours — the number of hours per day when sunlight is strong enough to generate rated output.

A 7 kW system in a location receiving 5 peak sun hours daily produces roughly 1,050 kWh per month before any losses for heat, shading, or inverter efficiency. Real-world losses typically run 15 to 20%, leaving approximately 840 to 890 kWh of usable generation — enough to cover a 900 kWh household almost completely. In dollar terms, that output is worth about $101 per month at a 12-cent rate, $138 at the 16-cent national average, $224 in a high-rate state like California at 26 cents, and as much as $336 in Hawaii at 39 cents per kWh. For a full price breakdown by system size and region, see our guide to How Much Do Solar Panels Cost in 2026? Complete US. For more on this topic, see our guide to How Much Do Solar Panels Save Per Year? 2026 Data.

If your household uses significantly more than 900 kWh — because you charge an electric vehicle, run a pool pump, or cool a large home through a hot summer — you will want a larger system. A 10 kW array in a medium-sun state can offset 1,100 to 1,200 kWh monthly, saving $175 to $200 per month at mid-tier rates. NREL’s PVWatts data confirms that for most of the continental US, each additional kilowatt of installed capacity adds 100 to 140 kWh of monthly generation depending on location.

Oversizing is not always the answer. If your utility caps net metering credits or pays below retail rate for exported power, surplus generation beyond your consumption earns less than it costs to produce. Getting the system size matched closely to your actual load profile — factoring in any planned purchases like an EV or heat pump over the next three to five years — is where careful upfront planning pays off most. Installers who propose a system without reviewing at least 12 months of your utility bills are skipping a step that costs homeowners real money.

The Role of Net Metering in Your Monthly Solar Bill Offset

Net metering rules can make or break the economics of residential solar, yet many homeowners do not examine them closely before signing an installation contract. Under full retail net metering — still the standard in most US states — every kilowatt-hour your panels export to the grid during the day offsets a kilowatt-hour you draw at night, dollar for dollar. Your monthly savings therefore reflect your total generation, not just the electricity you consume the instant it is produced.

California revised its net metering policy in 2023 under NEM 3.0, cutting export credits to around 5 cents per kWh — well below the state’s average retail rate of 26 cents. That single change reduced the monthly savings potential for new California solar customers by roughly 15 to 25% compared to the prior NEM 2.0 framework, though battery storage and higher self-consumption have partially restored the economics for many households.

States with strong full-retail net metering — including Massachusetts, Florida, and Texas — still allow homeowners to bank surplus generation at full retail value. In those states, a properly sized system can genuinely zero out the electricity bill nine or ten months of the year, with only winter months creating a net bill. Massachusetts homeowners with full net metering and an average retail rate of 28 cents per kWh can achieve monthly savings of $160 to $180 on a standard 7 kW system.

If you are in a state moving away from retail net metering, pairing solar with battery storage changes the calculation substantially. A 10 kWh battery stores midday surplus for evening use instead of exporting it at a discounted rate, recovering the full self-consumption value of that energy. The financial case for storage depends heavily on the gap between your utility’s retail rate and its export credit rate. You can model those scenarios with a solar net metering calculator to see whether storage makes economic sense at your specific utility’s export rate.

What Solar Panels Save in Year One Versus Year 25

Your first full year of solar savings sets the baseline, but the financial case strengthens every year electricity rates rise. The EIA reported average annual residential electricity price inflation of 2.8% between 2000 and 2023 — modest in any single year, but compounding significantly over a 25-year panel warranty period.

A homeowner saving $130 per month in year one accumulates $1,560 in annual savings. If utility rates rise 3% annually — a conservative assumption based on historical EIA data — by year ten that same system is offsetting what would be a $169 monthly bill, and by year twenty it offsets a roughly $221 monthly bill in nominal dollars. Over 25 years, total savings on a system producing $130 per month in year one reach approximately $54,000 in nominal terms before any financing costs are deducted.

Subtract installation costs to find net lifetime savings. The national average cost for a 7 kW system in 2025 was approximately $17,000 to $20,000 before the 30% federal Investment Tax Credit (ITC). After applying the ITC, out-of-pocket cost drops to $12,000 to $14,000. At $130 per month in savings, payback arrives in 7.7 to 9 years — leaving 15 to 17 years of savings that are essentially pure return on the original investment.

System degradation slightly reduces output over time. NREL research puts average panel degradation at about 0.5% per year, meaning a system producing 900 kWh per month in year one produces around 789 kWh per month by year 25. That is still more than enough to offset most household loads, particularly as higher future electricity rates compensate for the modest output decline. A homeowner who installs today at $130 per month in savings and holds the system for its full 25-year life will, in most scenarios, achieve a net return of $35,000 to $45,000 after the initial system cost. Use the solar payback calculator to enter your exact quote, utility rate, and local incentives and get a precise year-by-year projection.

Factors That Push Monthly Solar Savings Higher or Lower

Several practical variables push real-world monthly savings above or below the state averages. Understanding them before installation helps you set accurate expectations and identify where an installer’s proposal may not reflect your actual home.

Roof orientation and shading have an outsized impact on output. A south-facing roof at a 30-degree tilt in the continental US captures near-maximum solar irradiance year-round. An east/west roof split reduces output by 15 to 20% compared to a true south orientation. Even modest shading — a chimney, a dormer, or a tree branch crossing panels during the low winter sun — can reduce annual output by 10 to 30% depending on whether the system uses string inverters or module-level power electronics. Microinverters and DC optimizers mitigate shading losses significantly, often recovering 8 to 15% of otherwise lost generation.

Time-of-use electricity rates change the savings math for homes with heavy evening loads. Under TOU pricing — now standard for most new solar customers in California and increasingly offered in other states — peak-hour electricity typically costs 30 to 50% more than off-peak rates. A solar system that offsets midday usage still cuts the total bill, but pairing panels with a battery that shifts generation into the evening peak can increase monthly savings by an additional $20 to $40 compared to solar alone.

State and local incentives beyond the federal ITC reduce your net system cost and shorten payback. New York offers a state income tax credit of 25% of installed cost up to $5,000, stacked on top of the federal 30% ITC. Several states also waive sales tax on solar equipment and exempt added home value from property taxes for solar installations. These incentives do not increase monthly generation, but they reduce your break-even point by one to two years in most cases. Estimating your full incentive stack — federal, state, and local — before you commit to a quote is one of the most financially impactful steps a homeowner can take before signing a contract.

Frequently asked questions

Direct answers for US homeowners — sized for a $130/month electric bill.

The national average is $100 to $150 per month for a standard 6 to 8 kW residential system, based on EIA average rates and NREL output data. The actual figure depends on your system size, local electricity rate, roof quality, and net metering rules. Homeowners in high-rate states like Hawaii or Massachusetts typically save $180 to $220 per month, while those in low-rate states like Louisiana average closer to $78 per month.

$130/month electric bill by state

System size and payback vary by electricity rate and sun hours — see your state.

Compare all 50 states for $130/mo →

Popular state solar guides

Electricity rates and incentives vary — see data for your state.

View all 50 states →

Popular utility companies

Solar rules and net metering vary by utility — not just by state.

Methodology & data sources

Calculation method: System size uses NREL PVWatts derate factor (0.82). Costs based on SEIA 2026 installed cost ($2.75–$3.20/W). Payback uses net cost after 30% federal ITC (IRC Section 25D). Savings assume full-retail net metering unless noted.

Official sources: EIA state electricity rates · NREL PVWatts · Energy.gov ITC guide · DSIRE incentives · SEIA market data · IRS Publication 5695.

All figures are estimates for educational purposes — not tax, legal, or investment advice. Consult a licensed installer and CPA for your situation.

Calculate my savings →