US residential solar · 2026 data

Solar Cost for a 3,000 sq ft Home

SAVE

$0+

Over 25 Years

$26,500 Cost after ITC
11.0 yrs Payback
12.6 kW System size

Most homeowners need:

  • 30–35 panels
  • 12.6 kW system
  • $26,500 after tax credits
  • 11.0 year payback
✓ Updated monthly ✓ NREL data ✓ Reviewed by solar experts ✓ IRS tax credit included
· 9 min read ·By ·Reviewed by Green Energy Calculators Editorial Team

Without solar vs with solar

25-year cost comparison for a $300/month US electric bill.

Without solar

25-year utility cost

$101,100

Rates rise ~3% per year (EIA avg.)

With solar

Net system cost

$26,500

After 30% federal ITC

Your savings

Difference

+$74,500

Estimated lifetime advantage

500,000+
calculations completed
25,000+
users monthly

Trusted by US homeowners · Data sourced from

NREL EIA Energy.gov DSIRE IRS / SEIA
Author Mark Sullivan
Reviewed by Green Energy Calculators Editorial Team
Last updated
Sizing formula kW = Annual kWh ÷ (Peak Sun Hours × 365 × 0.82)

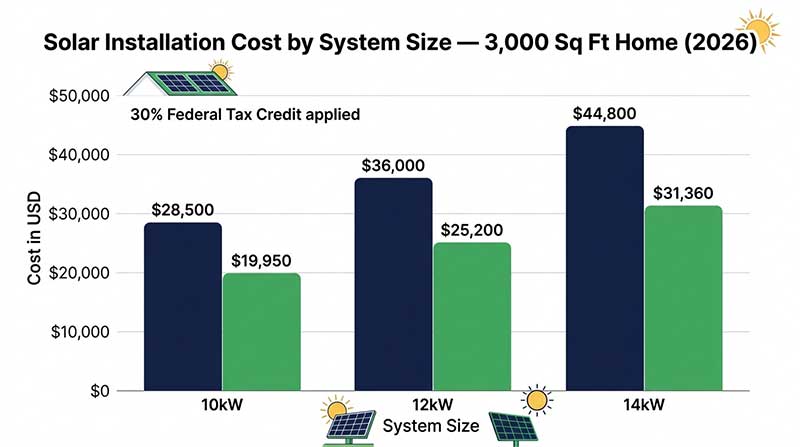
A 3,000 sq ft home in the United States typically needs a solar system between 10 kW and 14 kW, which costs $28,000 to $44,800 before incentives — and roughly $20,000 to $31,000 after the 30% federal tax credit. That’s a wide range, and where you land within it depends on your electricity usage, your roof’s sun exposure, the panels you choose, and the installer you hire. For most homeowners, solar at this scale delivers a payback period of 7 to 12 years, with the panels themselves warrantied for 25 years — meaning two decades or more of essentially free electricity after break-even.

The numbers above assume average US electricity consumption. A 3,000 sq ft home using electric heat, an EV charger, or a pool pump can push monthly usage well above the national average of around 886 kWh per month, which means a larger system and higher upfront cost. Conversely, an efficient home in a sun-rich state like Arizona might cover all its needs with a 10 kW array. The only reliable way to size your system is to pull 12 months of electricity bills and work from there.

This guide walks through every major cost factor for large-home solar: system sizing, per-watt pricing, installation costs, federal and state incentives, and realistic payback timelines. All figures are based on 2026 data from the Solar Energy Industries Association (SEIA) and the National Renewable Energy Laboratory (NREL).

How Big a Solar System Does a 3,000 Sq Ft Home Actually Need?

System size is driven by energy consumption, not square footage — but for a home this size, the two are closely linked. The US Energy Information Administration (EIA) reports the average American household uses about 10,632 kWh per year. A 3,000 sq ft home typically runs 15–30% above that average due to more rooms, larger HVAC loads, and greater lighting demands, putting annual usage somewhere between 12,000 and 15,000 kWh.

To produce 13,000 kWh per year, you need a system large enough to generate roughly 35–40 kWh per day. The exact panel count depends on your location’s peak sun hours — a variable that ranges from about 3.5 hours per day in the Pacific Northwest to over 6 hours per day in the Southwest. In practical terms, a home in California with 5.5 peak sun hours needs around a 10–11 kW system (roughly 25–27 panels at 400W each), while a home in Ohio with 4.2 peak sun hours needs closer to 13–14 kW (33–35 panels) to generate the same annual output.

Roof orientation and shading matter too. South-facing roofs with no tree cover are ideal; east-west orientations can still work but reduce output by 10–20%, meaning you’d need more panels to compensate. If you want to know exactly how many panels your roof can support based on your actual usage and location, the solar system size calculator at GreenEnergyCalc runs the math for your specific address and consumption profile.

Panel efficiency also plays a role. Standard 400W panels are the current market norm, but premium 440W+ panels from manufacturers like Maxeon or REC require fewer units — useful if your roof space is limited. The trade-off is a higher cost per panel, though they sometimes make financial sense when roof real estate is the constraint. Expect to pay roughly 15–25% more per watt for premium panels, partially offset by lower installation labor on smaller arrays.

Solar Installation Cost for a 3,000 Sq Ft Home in 2026

According to SEIA’s 2026 market data, the national average installed cost for residential solar sits at $2.85 to $3.20 per watt before incentives. For a 12 kW system — a reasonable midpoint for a 3,000 sq ft home — that produces three distinct cost scenarios based on home efficiency and local sun. To apply this credit correctly, start with a firm figure from our guide to How Much Do Solar Panels Cost in 2026? Complete US.

A low-end system for an efficient home in a sunny state runs 10 kW at $2.85 per watt, totaling $28,500. A mid-range system for an average home in an average-sun location runs 12 kW at $3.00 per watt, totaling $36,000. A high-end system for a high-usage home or a northern, shadier location runs 14 kW at $3.20 per watt, totaling $44,800. Those figures cover panels, inverter(s), racking hardware, wiring, permits, and installation labor — but do not include battery storage, which adds $10,000–$15,000 for a single unit. For more on this topic, see our guide to How Much Do Solar Panels Cost for a 2,000 Sq Ft Home?.

Bar chart showing total solar installation cost for 10kW, 12kW, and 14kW systems before and after federal tax credit
Solar installation cost by system size for a 3,000 sq ft home (2026). A 12 kW system costs approximately $36,000 before incentives and $25,200 after the 30% federal tax credit. Source: SEIA, IRS 2026.

Labor typically accounts for 10–15% of total installed cost, and rates vary significantly by region. Installers in Texas and the Midwest tend to quote lower labor rates than those in California or the Northeast, where permitting is more complex and wages higher. Getting at least three quotes from certified installers is the single most effective way to control cost — NREL research shows prices can vary by up to $0.50 per watt between competing installers in the same market, which on a 12 kW system is a $6,000 swing.

String inverters are the most affordable option at $1,000–$2,000 for a large system, while microinverters or power optimizers add $2,000–$4,000 but improve output on partially shaded roofs. For most 3,000 sq ft homes with a clear southern exposure, a string inverter with a strong manufacturer warranty represents the best value per dollar spent.

Solar vs utility company · 25-year comparison

Total cost of staying on the grid vs owning solar for a $300/month bill (national average assumptions).

Total utility payments

$101,100

Total solar cost (after ITC)

$26,500

Net savings

+$74,500

Avg. monthly difference

+$201/mo

See my savings →

Federal and State Incentives That Reduce Your Solar Cost

The federal Investment Tax Credit (ITC) — extended through at least 2032 under the Inflation Reduction Act — lets you deduct 30% of your total solar installation cost directly from your federal income tax liability. On a $36,000 system, that’s a $10,800 credit. This is not a rebate; it reduces what you owe the IRS dollar for dollar. If the credit exceeds your tax liability in year one, the remainder carries forward to the following year.

For homeowners adding battery storage, the ITC covers batteries as well, provided they are charged primarily from solar. A $36,000 solar system plus a $12,000 battery gives you a combined credit of $14,400, making storage substantially more affordable than it was before the IRA. You can model your exact credit based on your system cost and tax filing using the solar tax credit calculator.

State-level incentives layer additional savings on top. New York’s NY-Sun program offers rebates up to $5,000 for residential systems, and New York also provides a 25% state tax credit capped at $5,000 — stacking both with the federal ITC can reduce total system cost by more than 50%. Florida exempts solar equipment from both sales tax and property tax assessment, saving several thousand dollars even without a state income tax credit. Massachusetts offers among the best net metering rates in the country, with the SMART program adding a per-kWh performance incentive on top of retail-rate bill credits.

Net metering policy shapes your financial return over the life of the system. States with full retail net metering credit every kilowatt-hour you export at the same rate you pay for grid electricity. States that have shifted to avoided-cost or time-of-use net metering pay less per exported kWh, which meaningfully reduces long-term savings — particularly for large systems that regularly produce more than the home consumes during daylight hours.

Solar Payback Period and Long-Term Savings for Large Homes

Payback period is the number of years it takes for cumulative electricity savings to equal what you paid for the system. For a 3,000 sq ft home with a 12 kW system at the national average electricity rate of $0.16 per kWh (EIA 2026), annual generation of roughly 14,400 kWh offsets about $2,300 in electricity costs. Against a net system cost of $25,200 after the 30% ITC, that produces a simple payback of approximately 11 years.

That figure is conservative for two reasons. First, electricity prices have risen an average of 2.4% per year over the past decade according to EIA data, so your savings grow in dollar terms every year while a loan payment stays fixed. Factor in rate escalation and the effective payback shortens to 8–9 years for many homeowners. Second, solar systems routinely outperform their rated output during the first decade before any meaningful degradation occurs.

Geography shifts these numbers substantially. Hawaii homeowners pay over $0.39 per kWh — more than double the national average — which compresses payback to as little as 5–7 years even accounting for higher installation costs. Louisiana, by contrast, has among the lowest electricity rates in the country at around $0.10 per kWh, which extends payback to 14 or more years and weakens the financial case for solar without generous state incentives to compensate.

Financing matters too. Homeowners who pay cash get the strongest long-term return. Those who use a solar loan — typically at 5.99–8.99% APR over 10 to 25 years — still benefit financially, but monthly loan payments offset much of the bill savings in the early years. Leases and power purchase agreements require no upfront cash but transfer the federal tax credit to the installer and typically deliver less total savings over a 20-year horizon. Use the solar payback calculator to enter your actual electricity rate, annual usage, and system cost for a projection tailored to your home.

Choosing the Right Installer and Financing for Your Solar System

Selecting the right installer has as much impact on your long-term outcome as selecting the right panels. SEIA reported over 500,000 residential solar installations in 2025, and installer quality varies widely across this large market. Look for companies holding NABCEP (North American Board of Certified Energy Practitioners) certification, a verifiable local office, and reviews on independent platforms. Warranty terms matter separately from equipment: the best installers back their workmanship for 10 to 25 years, independent of what panel and inverter manufacturers cover.

Get a minimum of three written quotes. Each should specify the exact panel model and wattage, inverter brand, total system size in kW, estimated annual production in kWh, and an all-in installed price. A quote that omits production estimates or bundles unclear fees is a red flag. NREL data consistently shows that competitive bidding reduces average system cost by 5–10%, which on a $36,000 job amounts to $1,800–$3,600 in savings before any incentives.

For financing, a home equity loan or HELOC typically offers the lowest interest rate — often 6–7% in 2026 — and the interest may be tax-deductible depending on your situation. Purpose-built solar loans from lenders like Mosaic or Sunlight Financial are widely available at 5.99–8.99% APR and require no home equity. Be cautious of dealer-fee loan products, sometimes marketed as “zero-down” or “same as cash,” where a lender fee embedded in the loan inflates the effective cost of borrowing to 15% or higher.

If you own an electric vehicle or are considering adding one, sizing your solar array to cover both household use and EV charging is one of the most financially efficient approaches available. A 3,000 sq ft home that also charges an EV covering 300 miles per week needs roughly 2 kW of additional panel capacity — about $6,000 before the ITC — to offset that charging load completely. This combined home-plus-EV solar strategy produces some of the strongest lifetime savings of any residential solar configuration in 2026.

Frequently asked questions

Direct answers for US homeowners — sized for a 3,000 sq ft home.

Most 3,000 sq ft homes need between 25 and 35 solar panels, depending on electricity usage and location. At an average of 400 watts per panel, a 12 kW system requires about 30 panels. Homes in sunnier states like Arizona or Nevada may need fewer; homes in the Pacific Northwest or with significant shading may need more. Your installer calculates the exact count from your annual kWh consumption and roof layout.

Popular utility companies

Solar rules and net metering vary by utility — not just by state.

Methodology & data sources

Calculation method: System size uses NREL PVWatts derate factor (0.82). Costs based on SEIA 2026 installed cost ($2.75–$3.20/W). Payback uses net cost after 30% federal ITC (IRC Section 25D). Savings assume full-retail net metering unless noted.

Official sources: EIA state electricity rates · NREL PVWatts · Energy.gov ITC guide · DSIRE incentives · SEIA market data · IRS Publication 5695.

All figures are estimates for educational purposes — not tax, legal, or investment advice. Consult a licensed installer and CPA for your situation.

Calculate my savings →