US residential solar · 2026 data

Solar Cost for a 1,500 sq ft Home

SAVE

$0+

Over 25 Years

$12,300 Cost after ITC
11.0 yrs Payback
5.8 kW System size

Most homeowners need:

  • 13–18 panels
  • 5.8 kW system
  • $12,300 after tax credits
  • 11.0 year payback
✓ Updated monthly ✓ NREL data ✓ Reviewed by solar experts ✓ IRS tax credit included
· 11 min read ·By ·Reviewed by Green Energy Calculators Editorial Team

Without solar vs with solar

25-year cost comparison for a $300/month US electric bill.

Without solar

25-year utility cost

$46,800

Rates rise ~3% per year (EIA avg.)

With solar

Net system cost

$12,300

After 30% federal ITC

Your savings

Difference

+$34,500

Estimated lifetime advantage

500,000+
calculations completed
25,000+
users monthly

Trusted by US homeowners · Data sourced from

NREL EIA Energy.gov DSIRE IRS / SEIA
Author Mark Sullivan
Reviewed by Green Energy Calculators Editorial Team
Last updated
Sizing formula kW = Annual kWh ÷ (Peak Sun Hours × 365 × 0.82)

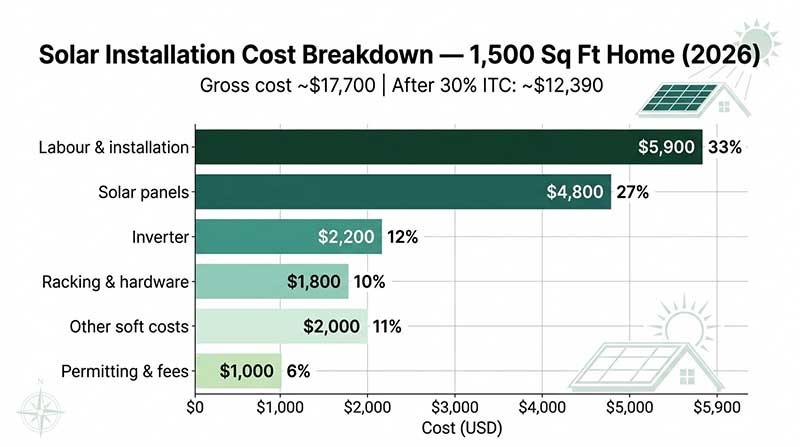
The average cost to install solar panels on a 1,500 square foot home in the US sits between $12,000 and $18,000 after applying the federal tax credit — making it one of the largest purchases most homeowners will ever make for energy savings. Before that credit, the gross price typically runs $17,000 to $25,000, depending on where you live, how much electricity you use, and the equipment your installer recommends. Understanding what drives that number is the fastest way to avoid overpaying and to set realistic expectations for when the system will actually pay for itself.

A 1,500 sq ft house doesn’t automatically translate to a fixed system size. Your monthly electricity bill matters far more than your floor plan. Two identical homes side by side can have wildly different solar needs if one runs a heat pump and an electric vehicle charger while the other has gas appliances and modest usage. That said, most 1,500 sq ft homes in the continental US consume between 800 and 1,100 kilowatt-hours (kWh) per month, which points toward a 6 to 8 kilowatt (kW) solar system as the right starting range.

This guide breaks down every cost layer — panels, inverters, labour, permits, and financing — so you can walk into installer quotes with confidence. It also covers the 30% federal solar tax credit still in effect for 2026, state incentive programs, and realistic payback timelines by region.

What Size Solar System Does a 1,500 Sq Ft Home Actually Need?

System size is the single biggest driver of total cost, so getting this right before collecting quotes saves real money. The formula installers use is straightforward: divide your average monthly kWh consumption by the average peak sun hours in your location, then add roughly 20% to account for panel inefficiency and real-world losses like shading and temperature.

For a 1,500 sq ft home using 900 kWh per month in a state like Arizona, which averages about 5.5 peak sun hours per day, the math works out to a 6 kW system. The same home in Massachusetts, with roughly 4.0 peak sun hours, would need closer to 7.5 kW to produce the same annual output. That difference — 1.5 kW — adds approximately $3,000 to $4,500 to the upfront cost, which is why location matters so much in solar pricing for homes of this size.

A 6 kW system typically requires 14 to 18 standard 370W to 400W panels, covering roughly 300 to 400 square feet of roof space. An 8 kW system needs 20 to 22 panels and around 400 to 500 square feet. Most 1,500 sq ft homes have adequate south-facing roof area, but roof age, pitch, and any shading from trees or chimneys can all reduce what’s usable. A reputable installer will perform a shading analysis before sizing your system.

Equipment tier also affects size requirements. Premium panels from manufacturers like REC, SunPower, or Panasonic achieve 21–23% efficiency, producing more electricity per square foot. Standard Tier-1 panels from Jinko, LONGi, or Canadian Solar run 19–21% efficiency but cost 15–25% less. For a home with limited south-facing roof space, the efficiency premium may be worth paying. For homes with ample roof room, standard panels deliver the same system output at meaningfully lower cost.

Battery storage is a separate decision entirely. Adding a single 10 kWh battery like the Tesla Powerwall adds $10,000 to $14,000 to a project. For most grid-tied homes, the financial case for storage depends almost entirely on whether your utility offers full net metering or time-of-use rates with high peak pricing. To find the right system size for your specific address and usage, the solar system size calculator at GreenEnergyCalc returns a personalised recommendation in under a minute.

Find your exact solar savings

Enter your ZIP code for a personalized estimate using your state's electricity rate and sun hours.

Free · No signup · Uses EIA & NREL data

How Much Does Solar Installation Cost in 2026 — by Component?

Breaking the total price into its parts makes it easier to compare installer quotes and spot where margins are being applied. According to the Solar Energy Industries Association (SEIA), the average installed cost of residential solar in the US was approximately $2.95 per watt in 2025, a figure that has declined steadily from $3.80 per watt in 2019. At that rate, a 6 kW system costs around $17,700 gross, and an 8 kW system runs about $23,600 before incentives.

Solar panels account for 25–30% of the total project cost. For a 6 kW system, expect to pay $4,400 to $5,300 for the panels themselves, depending on tier and brand. Premium panels carry a 20–35% price premium but come with 25-year production warranties versus the 10–12 year warranties more common on budget equipment. For more on this topic, see our guide to How Much Do Solar Panels Cost for a 2,000 Sq Ft Home?. For more on this topic, see our guide to How Much Do Solar Panels Cost for a 3,000 Sq Ft Home?.

Inverters make up 10–15% of cost. String inverters are the most affordable option at $1,000 to $2,500 for a whole-home system, but they underperform when any panel is shaded. Microinverters (Enphase is the dominant brand) cost $1,500 to $4,000 but allow panel-level optimisation — useful if your roof has partial shading from dormers or trees.

Racking and mounting hardware runs $1,000 to $2,500, including roof penetrations, rails, and clamps. Permitting, inspection, and utility interconnection fees add $500 to $1,500 depending on your municipality. Labour and installation typically accounts for 30–35% of the quote — this is highly regional, with costs noticeably higher in California and New England than in the South or Midwest.

After accounting for the 30% federal Investment Tax Credit (ITC), a $17,700 system becomes effectively $12,390. Many states layer additional incentives on top — New York’s NY-Sun incentive, for instance, can reduce costs by another $1,000 to $5,000 depending on system size and location.

Horizontal bar chart showing solar installation cost breakdown by component for a 1500 sq ft home in 2026
Where your solar dollar goes on a typical 1,500 sq ft installation. Labour is the largest single line item at 33% of gross cost; after the 30% federal ITC, a $17,700 system drops to approximately $12,390 net. Source: SEIA, NREL 2026.

Solar vs utility company · 25-year comparison

Total cost of staying on the grid vs owning solar for a $300/month bill (national average assumptions).

Total utility payments

$46,800

Total solar cost (after ITC)

$12,300

Net savings

+$34,500

Avg. monthly difference

+$93/mo

See my savings →

How Solar Panel Costs Vary by State

Geography is one of the biggest variables in solar pricing — not because panels cost more in some states, but because electricity rates, incentive programs, net metering policies, and sunlight levels all differ dramatically. A system that pays for itself in 7 years in one state may take 13 years in another, even at the same installed price.

Hawaii consistently shows the fastest payback periods in the country because its electricity rates average over 40 cents per kWh — nearly three times the national average of about 14 cents. A 6 kW system that generates $2,200 worth of electricity annually in a lower-rate state might generate over $5,000 in annual value in Hawaii. That’s why payback periods there often run under 6 years while states with low electricity rates and modest sunlight can see payback stretching to 12 to 15 years.

Texas presents an interesting middle case: excellent sunlight (5.0 to 6.0 peak sun hours across most of the state) but deregulated electricity markets that vary enormously by utility and plan, and no statewide solar incentive program. Net metering rules also vary by utility in Texas, with some providers offering only avoided-cost compensation rather than retail-rate credits — a difference that can add two or more years to a payback calculation.

In Florida, the Property Tax Exclusion for Residential Renewable Energy exempts the added home value from solar from property tax assessment — typically worth $3,000 to $8,000 in avoided tax over a 20-year period. The state also has a strong net metering law requiring utilities to credit solar production at retail rates, which is not the case in every state.

States with the highest average installed solar costs before incentives are generally in the Northeast, where labour costs are elevated and permitting takes longer. States with the lowest installed costs include Nevada and much of the Texas market, where installer density and simpler permitting have driven prices below $2.50 per watt in many cases. The National Renewable Energy Laboratory (NREL) publishes annual benchmarking data that tracks these regional cost differences in detail, and its most recent report confirms a spread of nearly $1.20 per watt between the highest- and lowest-cost states for residential installations.

What Is the Payback Period for Solar on a 1,500 Sq Ft Home?

The solar payback period — the number of years before cumulative electricity savings equal the net cost of your system — is the most practical financial measure for most homeowners evaluating a solar investment. For a 1,500 sq ft house, after applying the 30% federal ITC, payback periods across the US range from about 6 to 14 years, with a national median of roughly 8 to 9 years according to NREL data.

The formula is straightforward: divide the net system cost (after incentives) by the annual electricity savings the system produces. If your net cost is $13,000 and your system saves you $1,700 per year in electricity bills, your payback period is 7.6 years. From that point onward, the electricity the system generates is effectively free — for the remaining 17 or more years of the system’s rated lifespan.

Financing structure changes the calculation meaningfully. Paying cash gives you the full $1,700 per year in savings from day one. A solar loan spreads the net cost over time — a typical 10-year loan at 6.5% interest converts a $13,000 system into monthly payments of about $147, which is close to or less than the average monthly electricity bill of $140 to $175 in many US markets. That makes the switch cash-flow neutral or positive from the first month for many households.

Electricity rate inflation also works in your favour over time. The EIA reports that US residential electricity prices have risen an average of 2.5% per year over the past decade. Because the value of electricity your panels offset grows with those rising rates, the effective payback period compresses compared to a static analysis. Net metering policy is the other key variable — full retail-rate net metering is the most financially favourable arrangement, while avoided-cost compensation (typically 3 to 7 cents per kWh for excess generation) can add two to four years to a payback calculation.

Use the solar payback calculator to model your specific payback timeline using your actual electricity rate, local incentives, and financing terms — it’s the fastest way to turn a ballpark estimate into a number that reflects your home.

How to Finance Solar Panels for a 1,500 Sq Ft Home

Most homeowners buying solar today don’t pay cash. The three most common financing paths — solar loans, solar leases, and power purchase agreements (PPAs) — each have meaningful trade-offs that affect the total cost of going solar over a 25-year horizon.

Solar loans are the strongest option for most homeowners who qualify. You own the system outright, which means you claim the full 30% federal ITC yourself — worth $5,310 on a $17,700 gross system. You also benefit from any increase in home resale value. The Lawrence Berkeley National Laboratory has found that solar adds approximately $4 per watt to home resale value on average, which translates to roughly $24,000 for a 6 kW system. Loan terms typically run 10 to 25 years, with rates ranging from 4.9% to 8.9% depending on credit score and lender.

Solar leases and PPAs remove the upfront complexity but transfer ownership — and the tax credit — to the installer. In exchange, you pay a fixed monthly lease payment or a per-kWh rate for the electricity the system produces, typically 10 to 30% below your current utility rate. These arrangements make sense for homeowners who don’t have sufficient tax liability to use the ITC, or who prefer a maintenance-free arrangement where the installer handles all repairs and performance guarantees.

PACE financing (Property Assessed Clean Energy) is available in roughly 35 states and attaches the loan to the property rather than the borrower, repaid through a property tax assessment. It requires no upfront credit check in most programs, but the lien on the property must be paid off at sale — a detail worth discussing with your real estate agent before signing.

For New York residents, the NY-Sun Incentive Program provides upfront rebates of up to $1,000 per kW for systems under 25 kW, stackable on top of the 30% federal ITC. Oregon offers a Residential Energy Tax Credit of up to $6,000 for solar installations, one of the most generous state-level incentives in the country. Checking your state’s DSIRE database entry before signing any financing agreement ensures you don’t miss stackable incentives that could meaningfully reduce your out-of-pocket cost.

The right financing choice depends on your tax situation, credit profile, and how long you plan to stay in the home. Running a side-by-side comparison of loan versus lease scenarios — factoring in the tax credit, projected electricity savings, and loan interest — is the clearest way to make the decision with confidence.

Frequently asked questions

Direct answers for US homeowners — sized for a 1,500 sq ft home.

Most 1,500 sq ft homes need between 14 and 22 solar panels, depending on local sunlight levels and monthly electricity usage. A home consuming 900 kWh per month in a location with 4.5 peak sun hours typically requires a 6 to 7 kW system, equating to 16 to 19 standard 370W panels. Homes with higher electricity consumption or less available sunlight will need more panels to reach full offset.

Popular utility companies

Solar rules and net metering vary by utility — not just by state.

Methodology & data sources

Calculation method: System size uses NREL PVWatts derate factor (0.82). Costs based on SEIA 2026 installed cost ($2.75–$3.20/W). Payback uses net cost after 30% federal ITC (IRC Section 25D). Savings assume full-retail net metering unless noted.

Official sources: EIA state electricity rates · NREL PVWatts · Energy.gov ITC guide · DSIRE incentives · SEIA market data · IRS Publication 5695.

All figures are estimates for educational purposes — not tax, legal, or investment advice. Consult a licensed installer and CPA for your situation.

Calculate my savings →