US residential solar · 2026 data

How Many Solar Panels Do I Need?

SAVE

$0+

Over 25 Years

$16,800 Cost after ITC
9.3 yrs Payback
8.0 kW Typical system

Most homeowners need:

  • 20–24 panels typical
  • 8.0 kW average system
  • $16,800 after tax credits
  • 9.3 year payback
✓ Updated monthly ✓ NREL data ✓ Reviewed by solar experts ✓ IRS tax credit included
· 8 min read ·By ·Reviewed by Green Energy Calculators Editorial Team

Without solar vs with solar

25-year cost comparison for a $300/month US electric bill.

Without solar

25-year utility cost

$75,000

Rates rise ~3% per year (EIA avg.)

With solar

Net system cost

$16,800

After 30% federal ITC

Your savings

Difference

+$58,200

Estimated lifetime advantage

500,000+
calculations completed
25,000+
users monthly

Trusted by US homeowners · Data sourced from

NREL EIA Energy.gov DSIRE IRS / SEIA
Author Mark Sullivan
Reviewed by Green Energy Calculators Editorial Team
Last updated
Sizing formula kW = Annual kWh ÷ (Peak Sun Hours × 365 × 0.82)

The average American home uses 10,500 kilowatt-hours (kWh) of electricity per year, according to the U.S. Energy Information Administration — and that single number is the starting point for every solar panel calculation. Get it right, and your system covers most or all of your bill. Get it wrong, and you either overspend on capacity you never use, or you come up short and stay partly dependent on the grid.

The good news is that the math is straightforward. You need three inputs: how much electricity you use, how many peak sun hours your location gets, and how efficient the panels you’re buying actually are. This guide walks through each step, flags the variables that most online estimates ignore, and helps you sanity-check any quote a solar installer hands you.

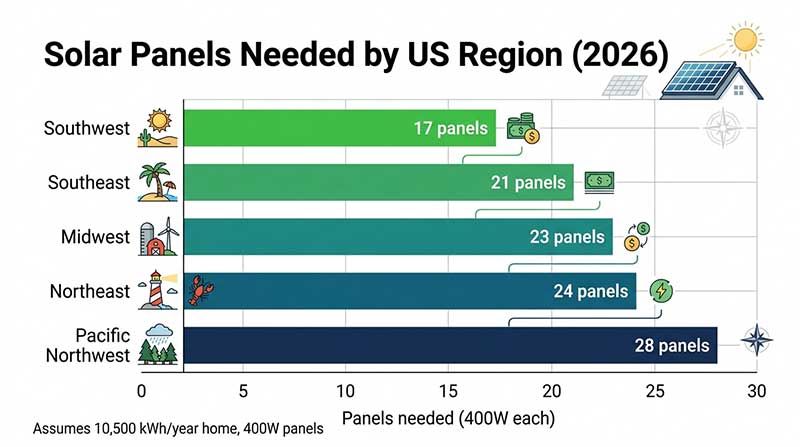
Whether you’re in sun-drenched Arizona or cloud-prone Washington, the formula is the same — only the numbers change.

Step 1: Calculate Your Annual Electricity Consumption

Your electricity bill is the most important document in this whole process. Pull the last 12 months of statements and add up the kilowatt-hours — not the dollar amounts, which fluctuate with rates. Most utilities print a rolling 12-month total on each bill, which makes this easy.

The national average sits at 10,500 kWh per year (EIA, 2024), but that figure masks enormous regional variation. A household in Louisiana, where air conditioning runs hard for eight months, averages closer to 14,400 kWh. A household in California, where mild coastal climates and aggressive efficiency standards keep usage down, might use only 7,000 kWh. Using the national average for your calculation when your real usage is 40% higher will leave your system undersized from day one.

Once you have your annual total, convert it to a daily average by dividing by 365. A home using 10,500 kWh annually consumes roughly 28.8 kWh per day. That daily figure is what you’ll use in the panel count formula in Step 3.

Two practical notes before moving on. First, if you’re planning to add an electric vehicle in the next few years, factor in that load now — a typical EV adds 3,000 to 4,500 kWh per year depending on how far you drive. Second, if you’ve recently added a heat pump or are planning to, that will also shift your consumption profile, often substantially. Sizing your solar system against today’s usage and then adding a major load next year is one of the most common and costly planning mistakes homeowners make. Getting your consumption baseline right before moving forward saves significant money.

Step 2: Find Your Peak Sun Hours

Peak sun hours measure how much solar energy your location receives in an average day, expressed as the number of hours at full 1,000 W/m² intensity. A location with 5 peak sun hours doesn’t mean the sun only shines for 5 hours — it means the total energy received across the full day equals what you’d get from 5 hours of peak intensity.

The National Renewable Energy Laboratory (NREL) publishes detailed solar resource maps showing peak sun hours by ZIP code. In practice, the range across the continental US runs from about 3.5 hours per day in the Pacific Northwest to over 6.5 hours per day in the desert Southwest. Nevada and New Mexico sit at the high end of the scale, regularly exceeding 6.0 hours; the upper Midwest and northern New England sit at the low end, often below 4.0 hours.

Why does this matter so much? Because a 400W panel installed in Phoenix will generate nearly twice the annual electricity of the same panel installed in Seattle. If you use a national average sun-hour figure — commonly cited as 4.5 hours — instead of your actual local figure, your panel count estimate could be off by 20% to 30%. That error translates directly into thousands of dollars of misspent installation budget.

To find your specific number, search “peak sun hours [your city]” or use NREL’s PVWatts Calculator, which is free and draws on decades of satellite weather data. For a rough regional rule of thumb: the Northeast averages 4.0–4.5 hours per day; the Southeast 4.5–5.5; the Southwest 5.5–6.5; the Pacific Northwest 3.5–4.0. A system designed using the wrong regional figure rather than your actual ZIP code figure can result in a 15–25% shortfall in expected annual output — a gap most homeowners only discover after installation when their first full-year utility bills don’t match the installer’s projections.

Horizontal bar chart showing average number of 400W solar panels needed for a typical home across five US regions
Panel count varies sharply by region. A typical 10,500 kWh/year home needs only 17 panels in the Southwest but 28 panels in the Pacific Northwest — a difference driven entirely by peak sun hours. Source: NREL, EIA 2026.

Step 3: Apply the Solar Panel Count Formula

With your daily kWh and your peak sun hours in hand, the core formula is:

Number of panels = Daily kWh ÷ (Peak sun hours × Panel wattage ÷ 1,000)

Walk through a real example. A home in Texas uses 13,000 kWh per year (35.6 kWh/day) and receives 5.5 peak sun hours. The homeowner is considering 400W panels.

35.6 ÷ (5.5 × 0.4) = 35.6 ÷ 2.2 = 16.2 panels

Round up to 17 panels for a system that covers annual consumption. At roughly $3.00 per watt installed (the current national average per SEIA’s 2024 data), a 6.8 kW system (17 × 400W) costs approximately $20,400 before incentives. After the 30% federal Investment Tax Credit, that falls to around $14,280. For a full price breakdown by system size and region, see our guide to How Much Do Solar Panels Cost in 2026? Complete US.

One important adjustment: real-world systems don’t operate at 100% efficiency. Heat, shading, inverter losses, and wiring all reduce actual output to roughly 80% of nameplate capacity in practice. To account for this, many installers apply a “system efficiency factor” of 0.8. Applying that to the Texas example: 35.6 ÷ (5.5 × 0.4 × 0.8) = 20.2 panels, or 21 rounded up. That is the more conservative — and more accurate — approach used by professional system designers.

Using our solar system size calculator automates this entire process with local sun-hour data already built in, so you don’t have to look up NREL figures manually or work through the math yourself.

Find your exact solar savings

Enter your ZIP code for a personalized estimate using your state's electricity rate and sun hours.

Free · No signup · Uses EIA & NREL data

Step 4: Check Whether Your Roof Can Fit the Panels

Calculating how many panels you need is only half the problem. The other half is whether your roof has the usable space to fit them. A standard 400W residential solar panel measures roughly 6.5 feet by 3.3 feet, occupying about 21.5 square feet. A 20-panel system needs approximately 430 square feet of unobstructed, south- or southwest-facing roof space.

Several factors eat into your usable area. Roof penetrations — vents, skylights, chimneys — require setback clearance of at least 12 inches on each side. Local fire codes in many states mandate 3-foot clear pathways across the roof for firefighter access. Shading from trees or neighboring buildings can eliminate entire sections. A roof with 600 square feet of total south-facing area might have only 350 usable square feet once all of these constraints are applied.

If your roof genuinely can’t fit the panels your consumption requires, you have three realistic options. First, reduce consumption before finalizing panel count — smart thermostat savings and LED upgrades together can cut 10–15% of household usage, which directly shrinks the number of panels you need. Second, accept partial offset: a system covering 70% or 80% of your annual bill still saves $800 to $1,200 per year for most households. Third, explore ground-mounted arrays if you have yard space — they cost 10–15% more to install but eliminate all roof constraint issues and can be oriented for optimal production year-round.

Florida homeowners face an additional layer of complexity: hurricane and wind-load building codes require specific racking systems that affect panel placement and can reduce the maximum number of panels a roof section can structurally support by 10–20% compared to other states.

Step 5: Understand Tax Credits and Verify Your Installer’s Quote

Once you’ve run your own panel count estimate, use it as a benchmark when comparing installer proposals. A reputable installer should come within two or three panels of your own calculation. A proposal that runs 30% higher than your math deserves a direct question: “What consumption figure and sun-hour assumption are you using?” If the installer can’t answer that clearly, treat it as a red flag.

The 30% federal Investment Tax Credit (ITC) under the Inflation Reduction Act applies to the full installed cost of a residential solar system placed in service through 2032. On a $20,000 system, that’s $6,000 back on your federal taxes in the year of installation, per IRS guidelines. Some states layer additional credits on top — New York offers up to $5,000 in state credit, and Massachusetts provides a 15% state credit capped at $1,000. Stacking federal and state incentives can reduce your effective out-of-pocket cost by 35–40% in the most generous states.

Common reasons legitimate installer quotes differ from homeowner estimates: the installer is sizing for future load growth such as an EV or heat pump, they’re applying a more conservative system efficiency factor than 0.8, or they’re recommending a slightly larger system to fully absorb the ITC against your expected tax liability. All of these reasons are defensible — but you should understand each one before signing. To see your complete financial picture including payback period and lifetime savings, run your final system size through our solar payback calculator before committing to a contract. For state-by-state payback data, our guide to Solar Panel Payback Period by State is the most complete resource.

Frequently asked questions

Direct answers for US homeowners — sized for a $150/month electric bill.

Most US homes need between 17 and 25 panels to cover their full electricity use. The national average home consuming 10,500 kWh per year typically requires about 20 to 22 panels rated at 400W, assuming 4.5 peak sun hours. Homes in high-sun states may need as few as 15 panels; homes in cloudy northern states may need 28 or more.

$150/month electric bill by state

System size and payback vary by electricity rate and sun hours — see your state.

Compare all 50 states for $150/mo →

Popular state solar guides

Electricity rates and incentives vary — see data for your state.

View all 50 states →

Popular utility companies

Solar rules and net metering vary by utility — not just by state.

Methodology & data sources

Calculation method: System size uses NREL PVWatts derate factor (0.82). Costs based on SEIA 2026 installed cost ($2.75–$3.20/W). Payback uses net cost after 30% federal ITC (IRC Section 25D). Savings assume full-retail net metering unless noted.

Official sources: EIA state electricity rates · NREL PVWatts · Energy.gov ITC guide · DSIRE incentives · SEIA market data · IRS Publication 5695.

All figures are estimates for educational purposes — not tax, legal, or investment advice. Consult a licensed installer and CPA for your situation.

Calculate my savings →